The Stratum blog
How-tos, worked case studies, plain-language statistics explainers, and product news. The written companion to our video series — new posts every week.
🔖 Subscribe via RSS · New to Stratum? Start the 25-lesson tutorial →

Check whether your data is normal — read the line, spot skew and tails.
Sep 30, 2026 · 6 min read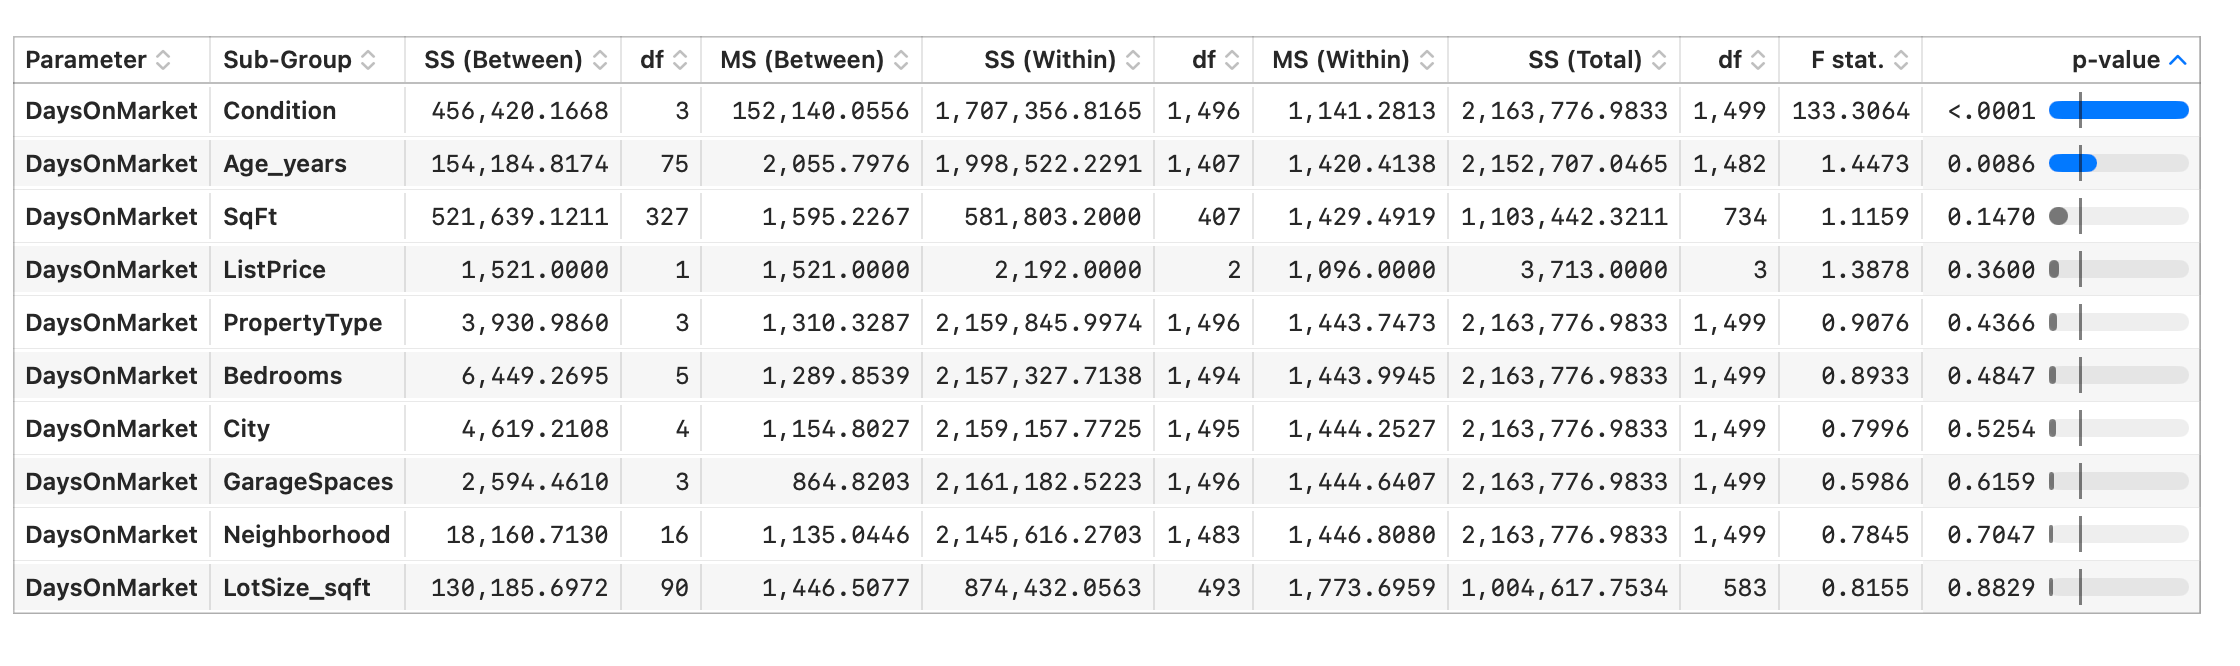
Where SPSS's established workflows fit, and where a lighter native app wins on cost.
Sep 25, 2026 · 7 min read
An interpretable model: grow it, prune it, read importance, and predict.
Sep 23, 2026 · 7 min read
Both compare groups, but one shows summaries and the other shows shape.
Sep 18, 2026 · 6 min read
Compare groups by full distribution shape — and spot bimodality a box plot hides.
Sep 16, 2026 · 6 min readWhere Prism's biostatistics focus shines, and where a broader native app fits.
Sep 11, 2026 · 7 min read
See every variable pair at once with the Scatter chart's Matrix mode.
Sep 9, 2026 · 6 min read
Read every pair's relationship at once, with the significant ones highlighted.
Sep 4, 2026 · 6 min read
R², VIF, Cook's distance and residual plots — whether to believe the model.
Sep 2, 2026 · 7 min read
Build a model from menus, read R² and coefficients, and check the diagnostics.
Aug 28, 2026 · 7 min readWhere JMP's depth is worth it, and where a lighter native Mac app wins.
Aug 26, 2026 · 7 min read
Loadings tell you what a component means; scores tell you where each observation sits.
Aug 21, 2026 · 7 min read
Reduce many variables to a few components; read the scree plot and biplot.
Aug 19, 2026 · 7 min read
344 real penguins, a bill correlation that runs backwards until you split by species, then a decision tree, random forest and PCA that classify three species at ~98% — no code.
Dec 1, 2026 · 11 min read
Turn the most famous scatter in statistics into 142 connected trajectories and watch the development gap close — a full Gapminder analysis, no code, no animation.
Jan 4, 2027 · 14 min read
1,186 people, 14 characters, one chart. Correspondence Analysis maps a whole survey — and Jar Jar sits alone in the corner. No code.
Nov 2, 2026 · 10 min read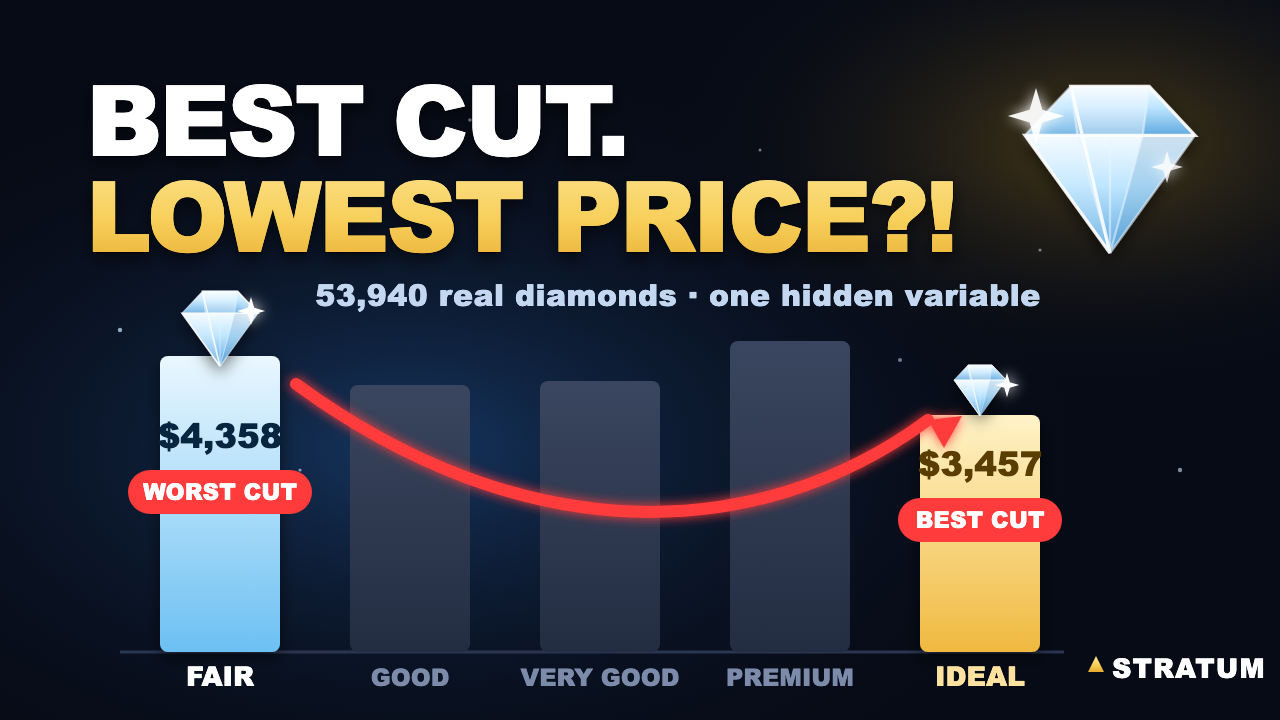
53,940 real diamonds, three quality grades that all run backwards, and the charts, ANOVA, regression, PCA and decision tree that crack it — no code.
Jul 31, 2026 · 13 min read
2,139 patients in the ACTG 175 HIV trial: the overall average said the drug worked, one arm said it harmed, and the honest answer lived in the subgroups — paired t-test, effect size, responder rate, ANOVA, MANOVA and ANCOVA. No code.
Sep 1, 2026 · 13 min read
A capability report says Ppk 1.36 — a pass. On 200 real piston-ring measurements, SPC control charts catch the drift that single number hides. The Six-Sigma rule: control before capability. No code.
Oct 1, 2026 · 6 min read
How SPC tells ordinary variation from a real change — and what the Nelson rules detect.
Aug 14, 2026 · 7 min read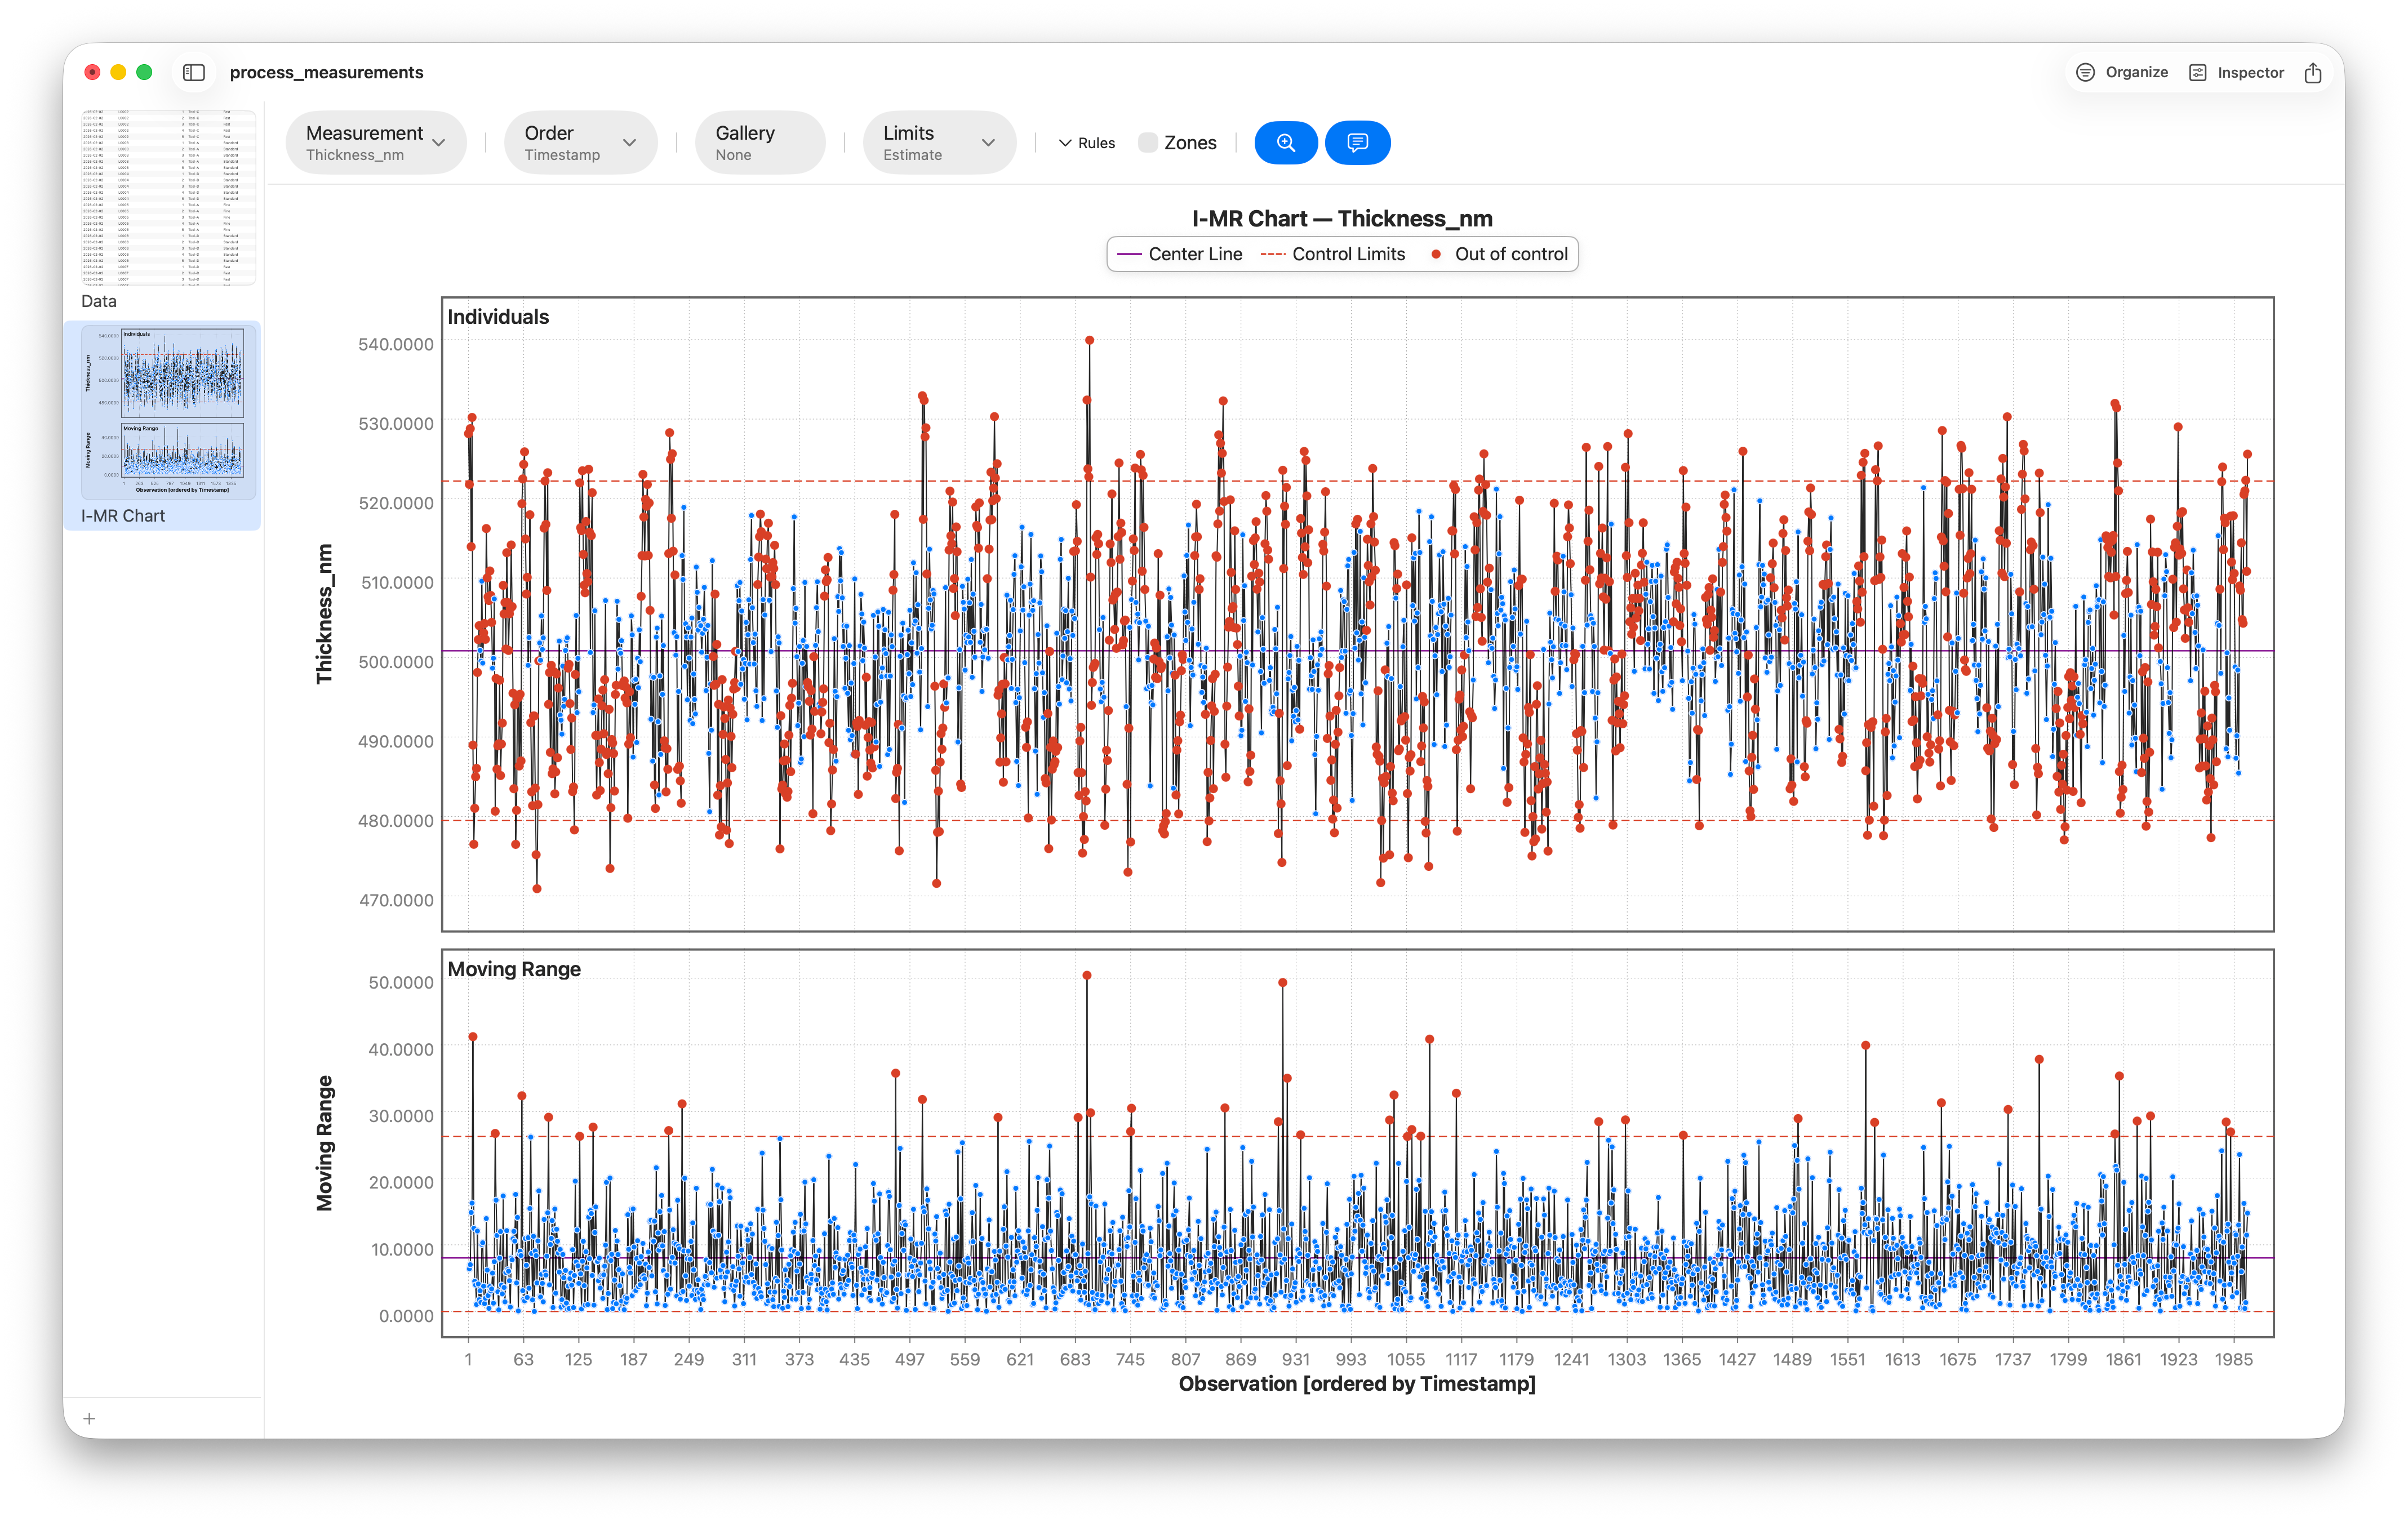
I-MR and X-bar charts with control limits and automatic Nelson-rule flagging.
Aug 12, 2026 · 7 min readNative apps vs Excel vs R/Python vs the big suites — an honest map of the options.
Aug 7, 2026 · 8 min read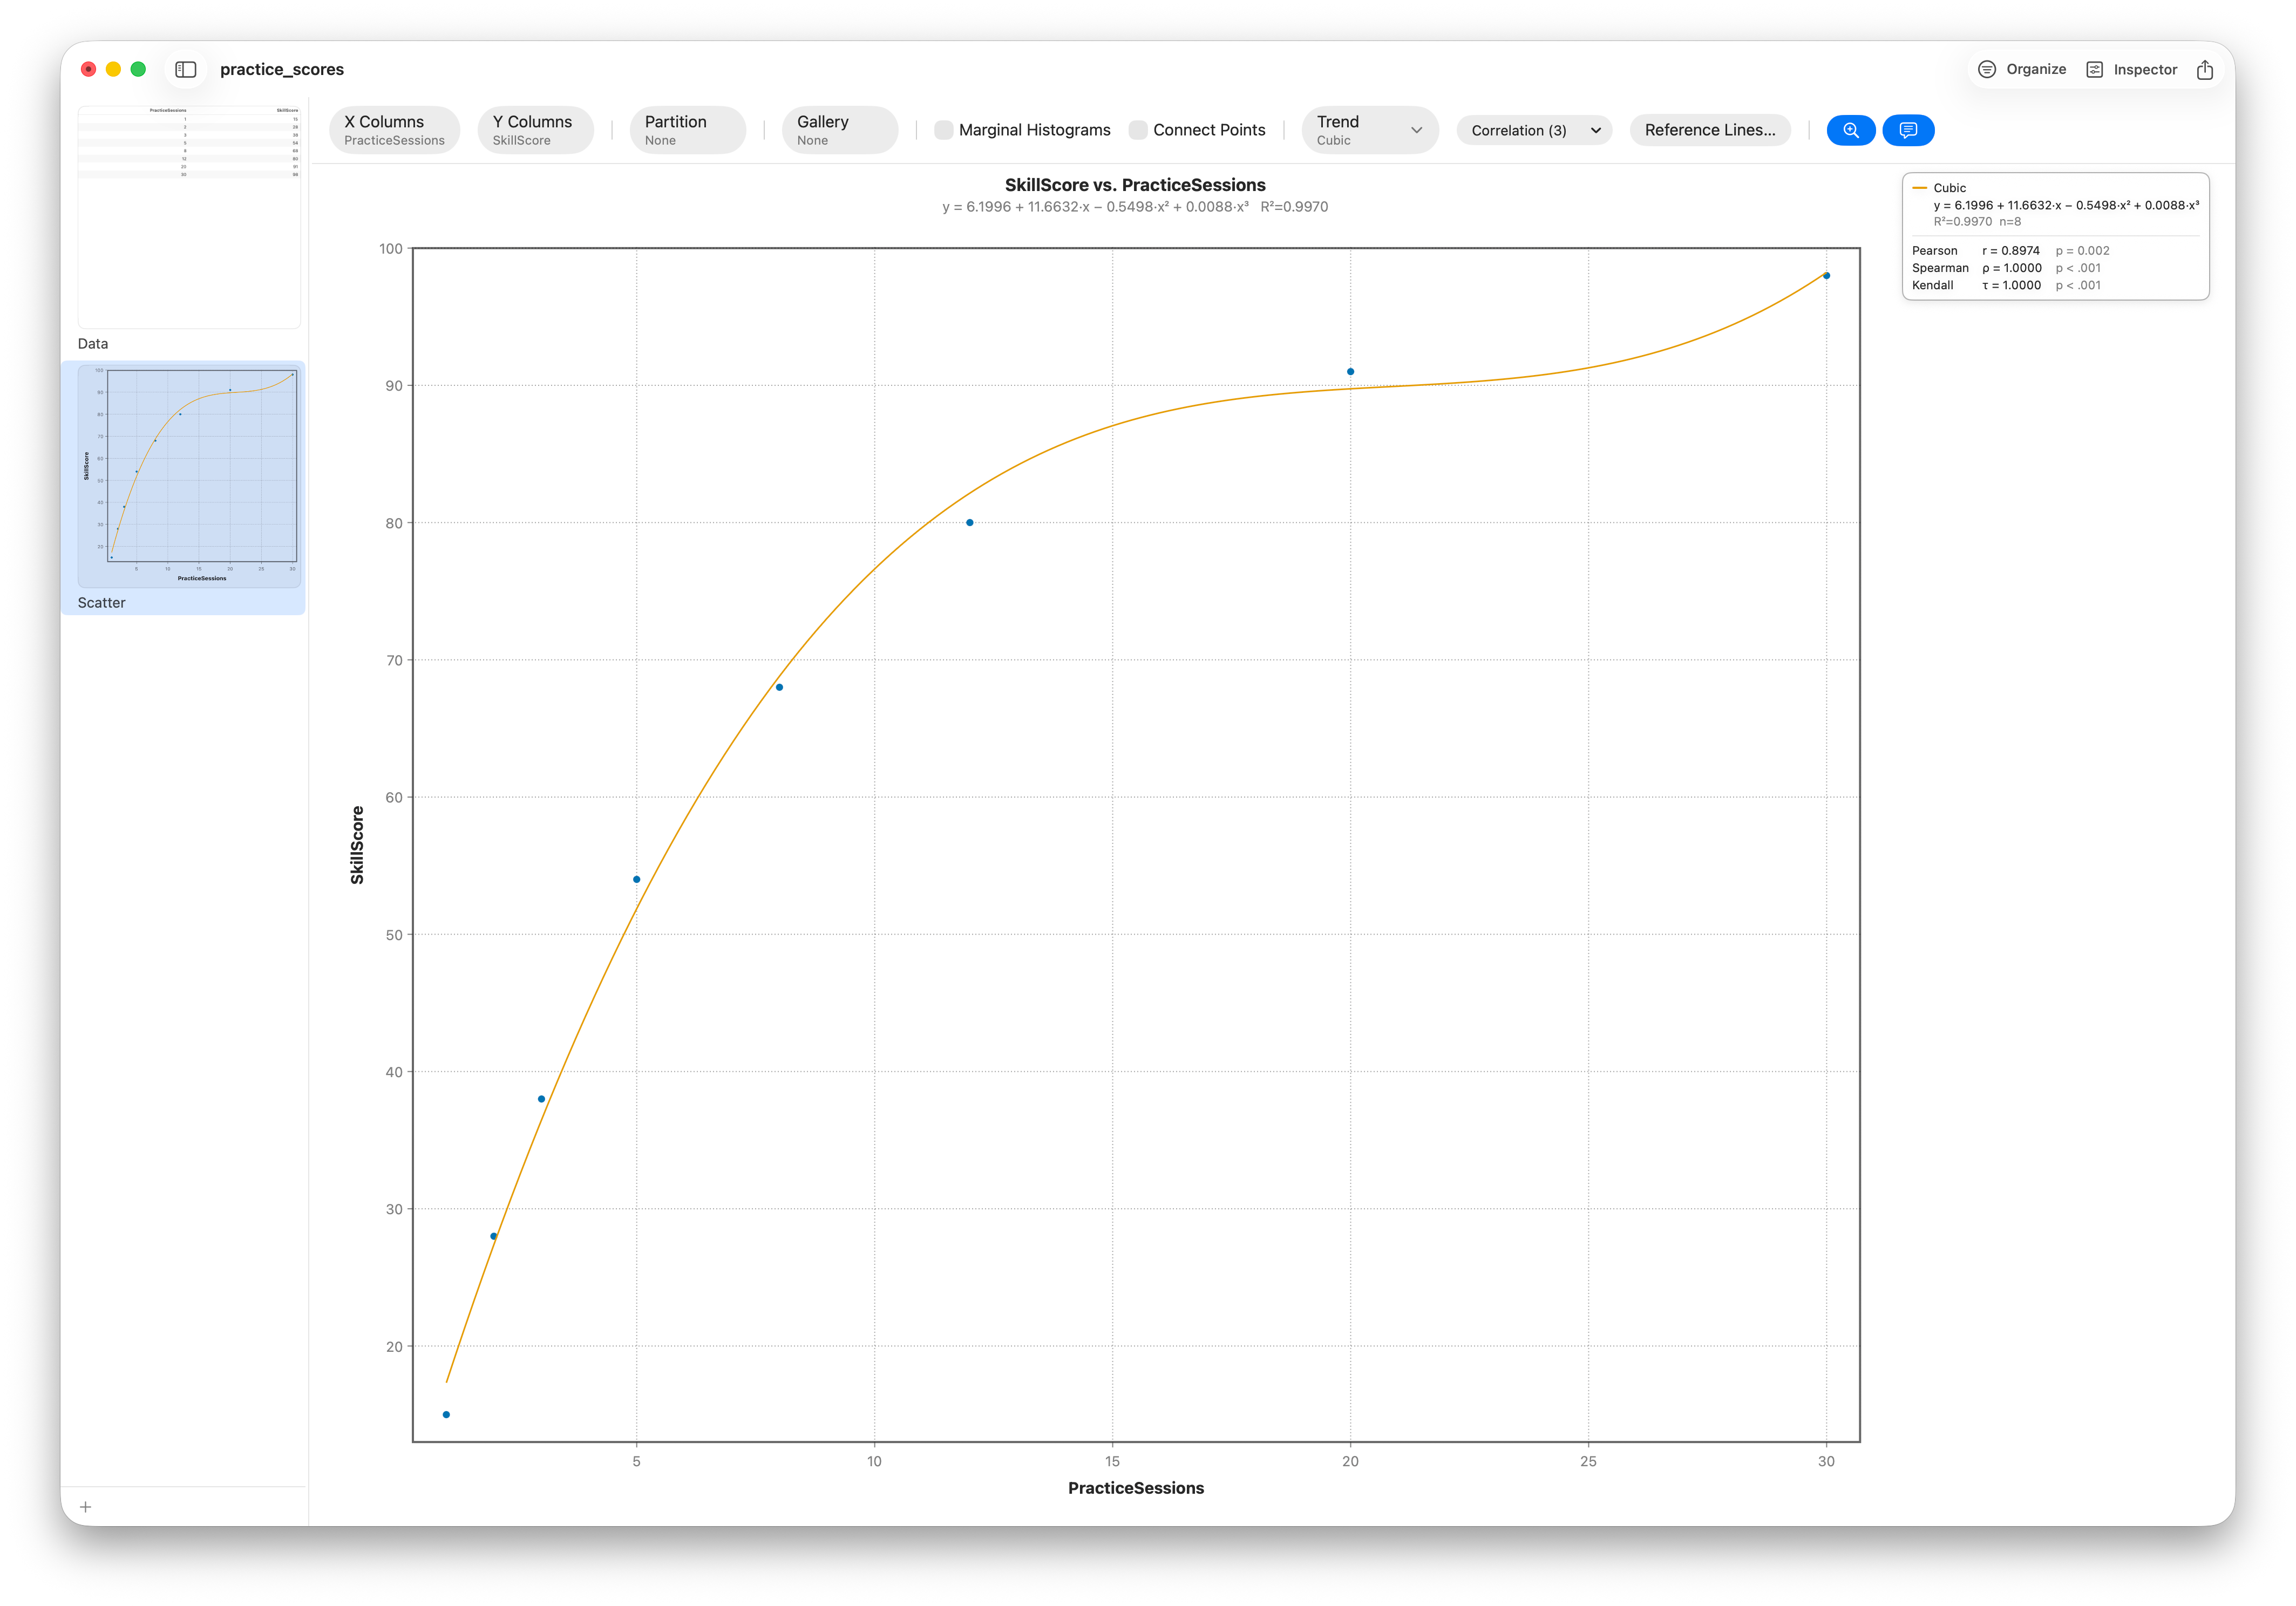
What correlation does and doesn't mean, and when to use Pearson vs Spearman.
Aug 5, 2026 · 7 min read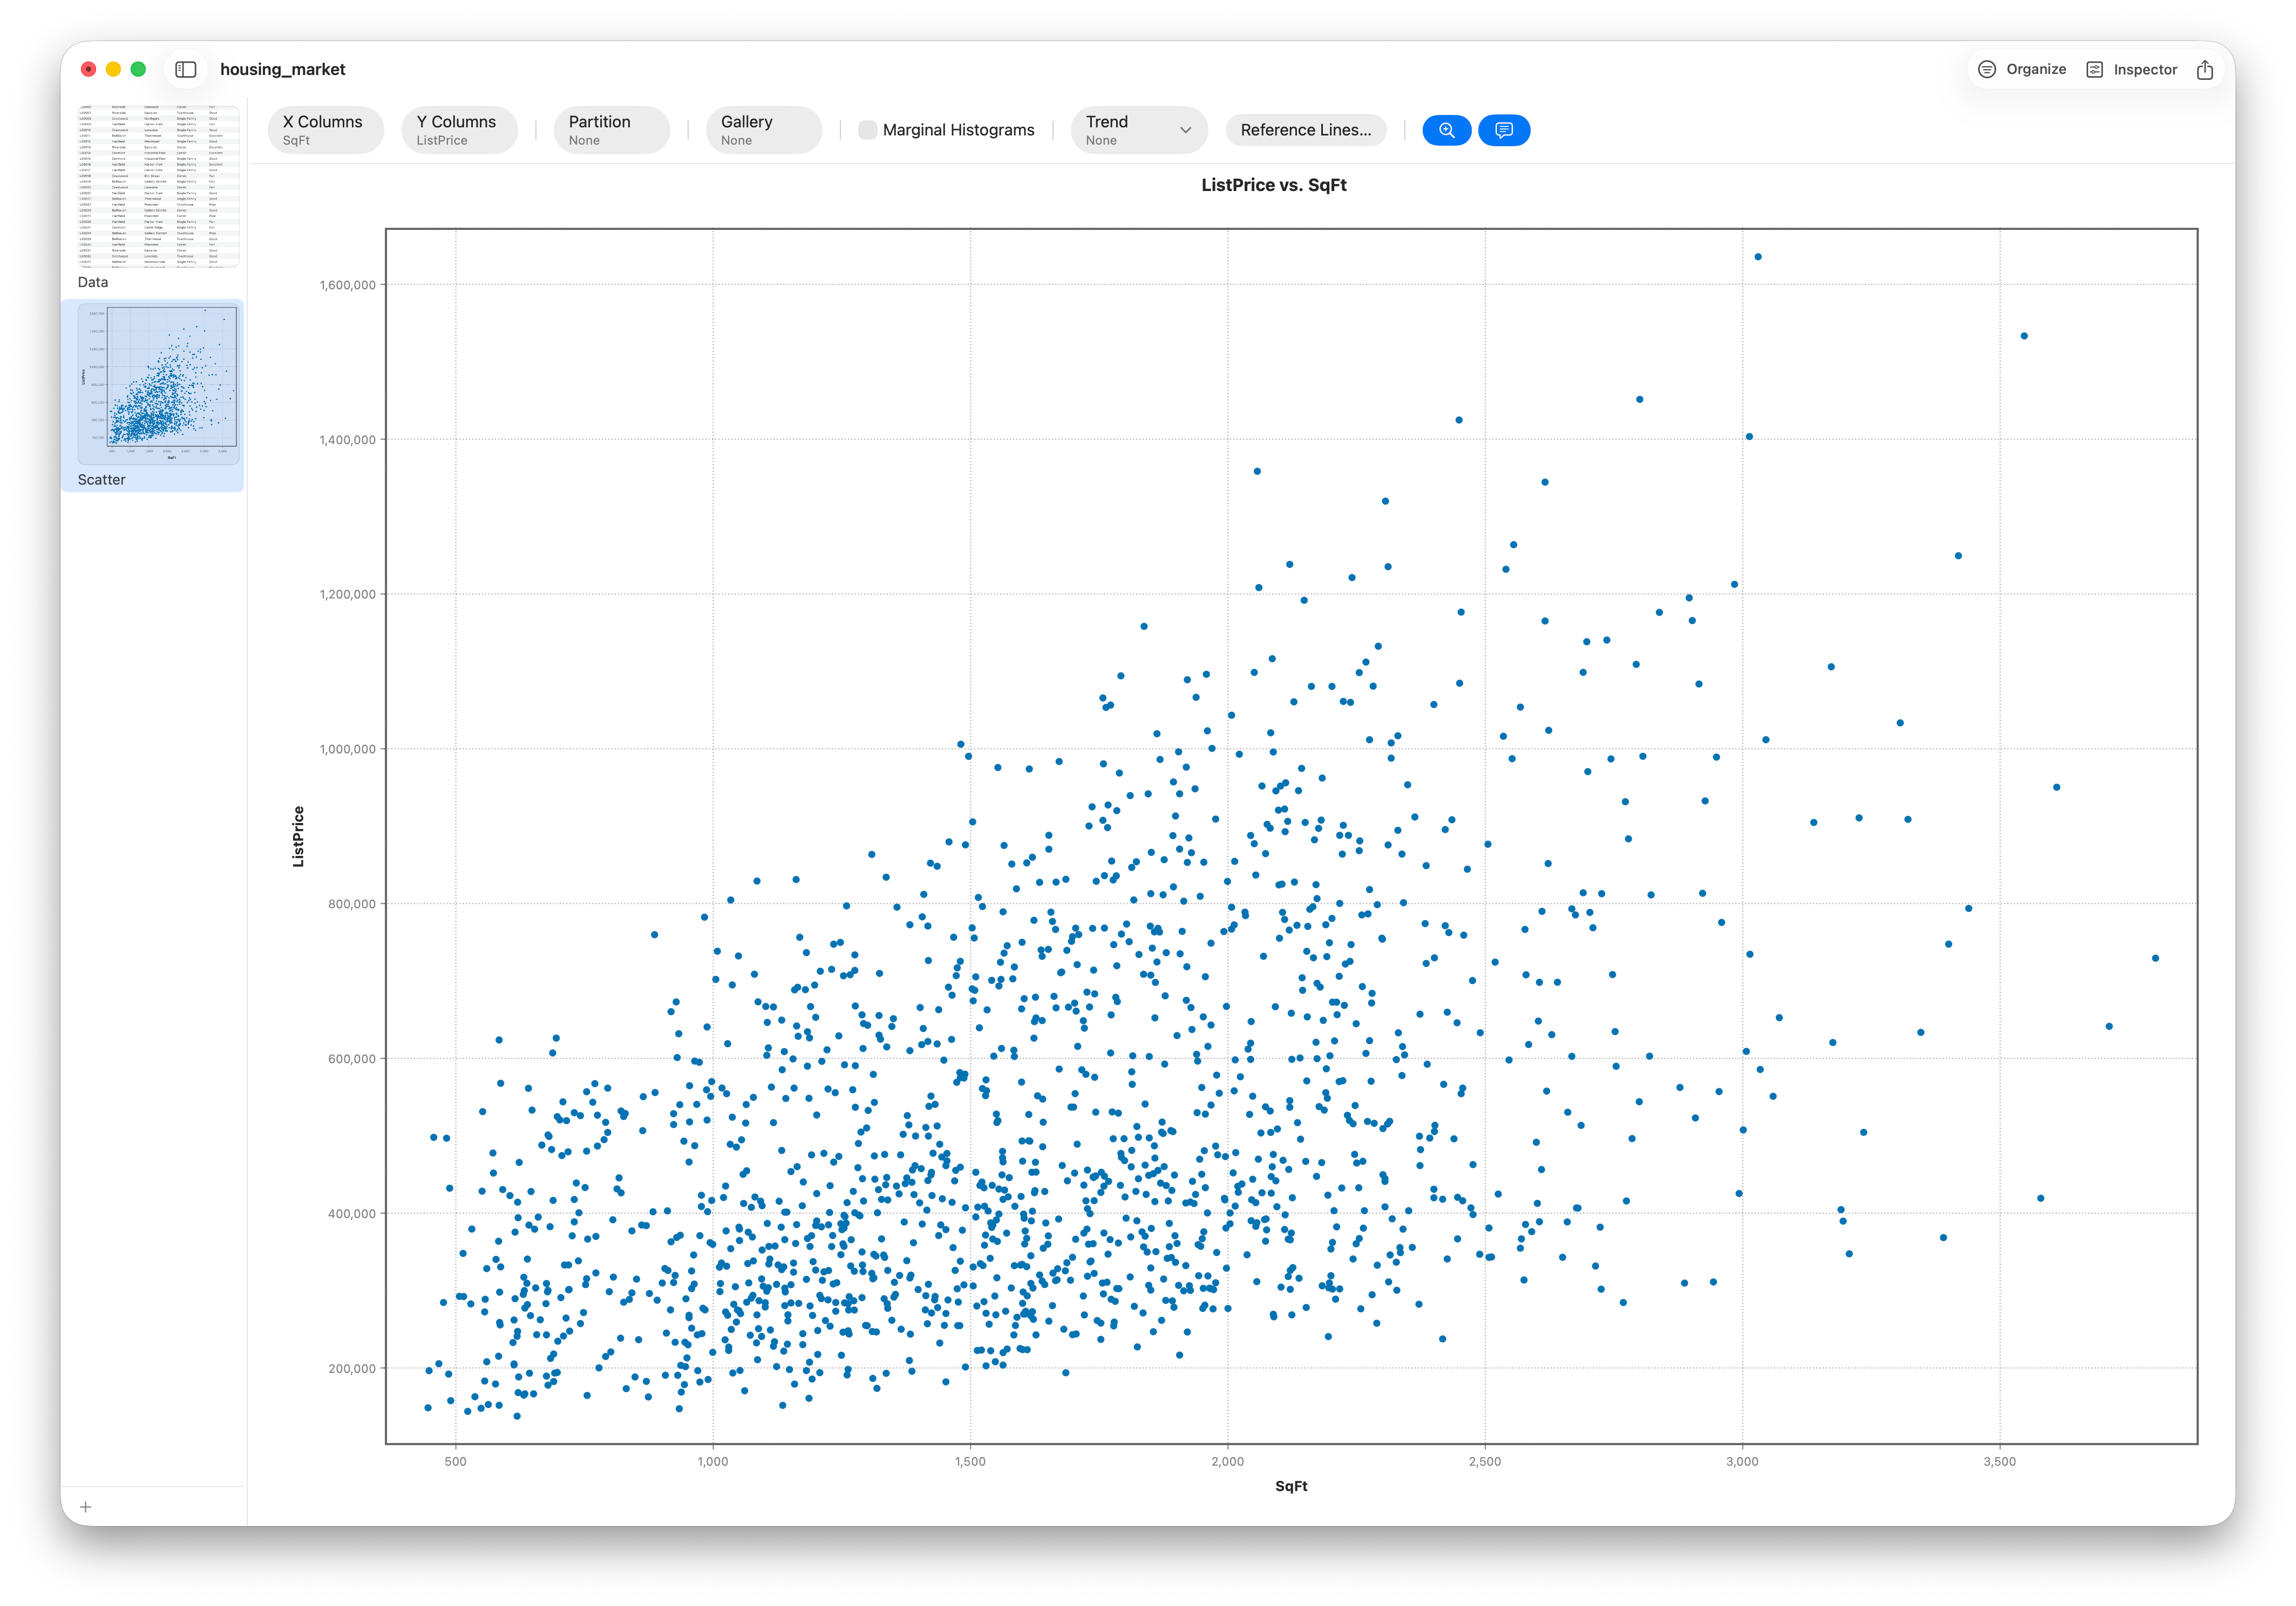
Plot two variables, add a line of best fit, and read the correlation.
Jul 31, 2026 · 6 min read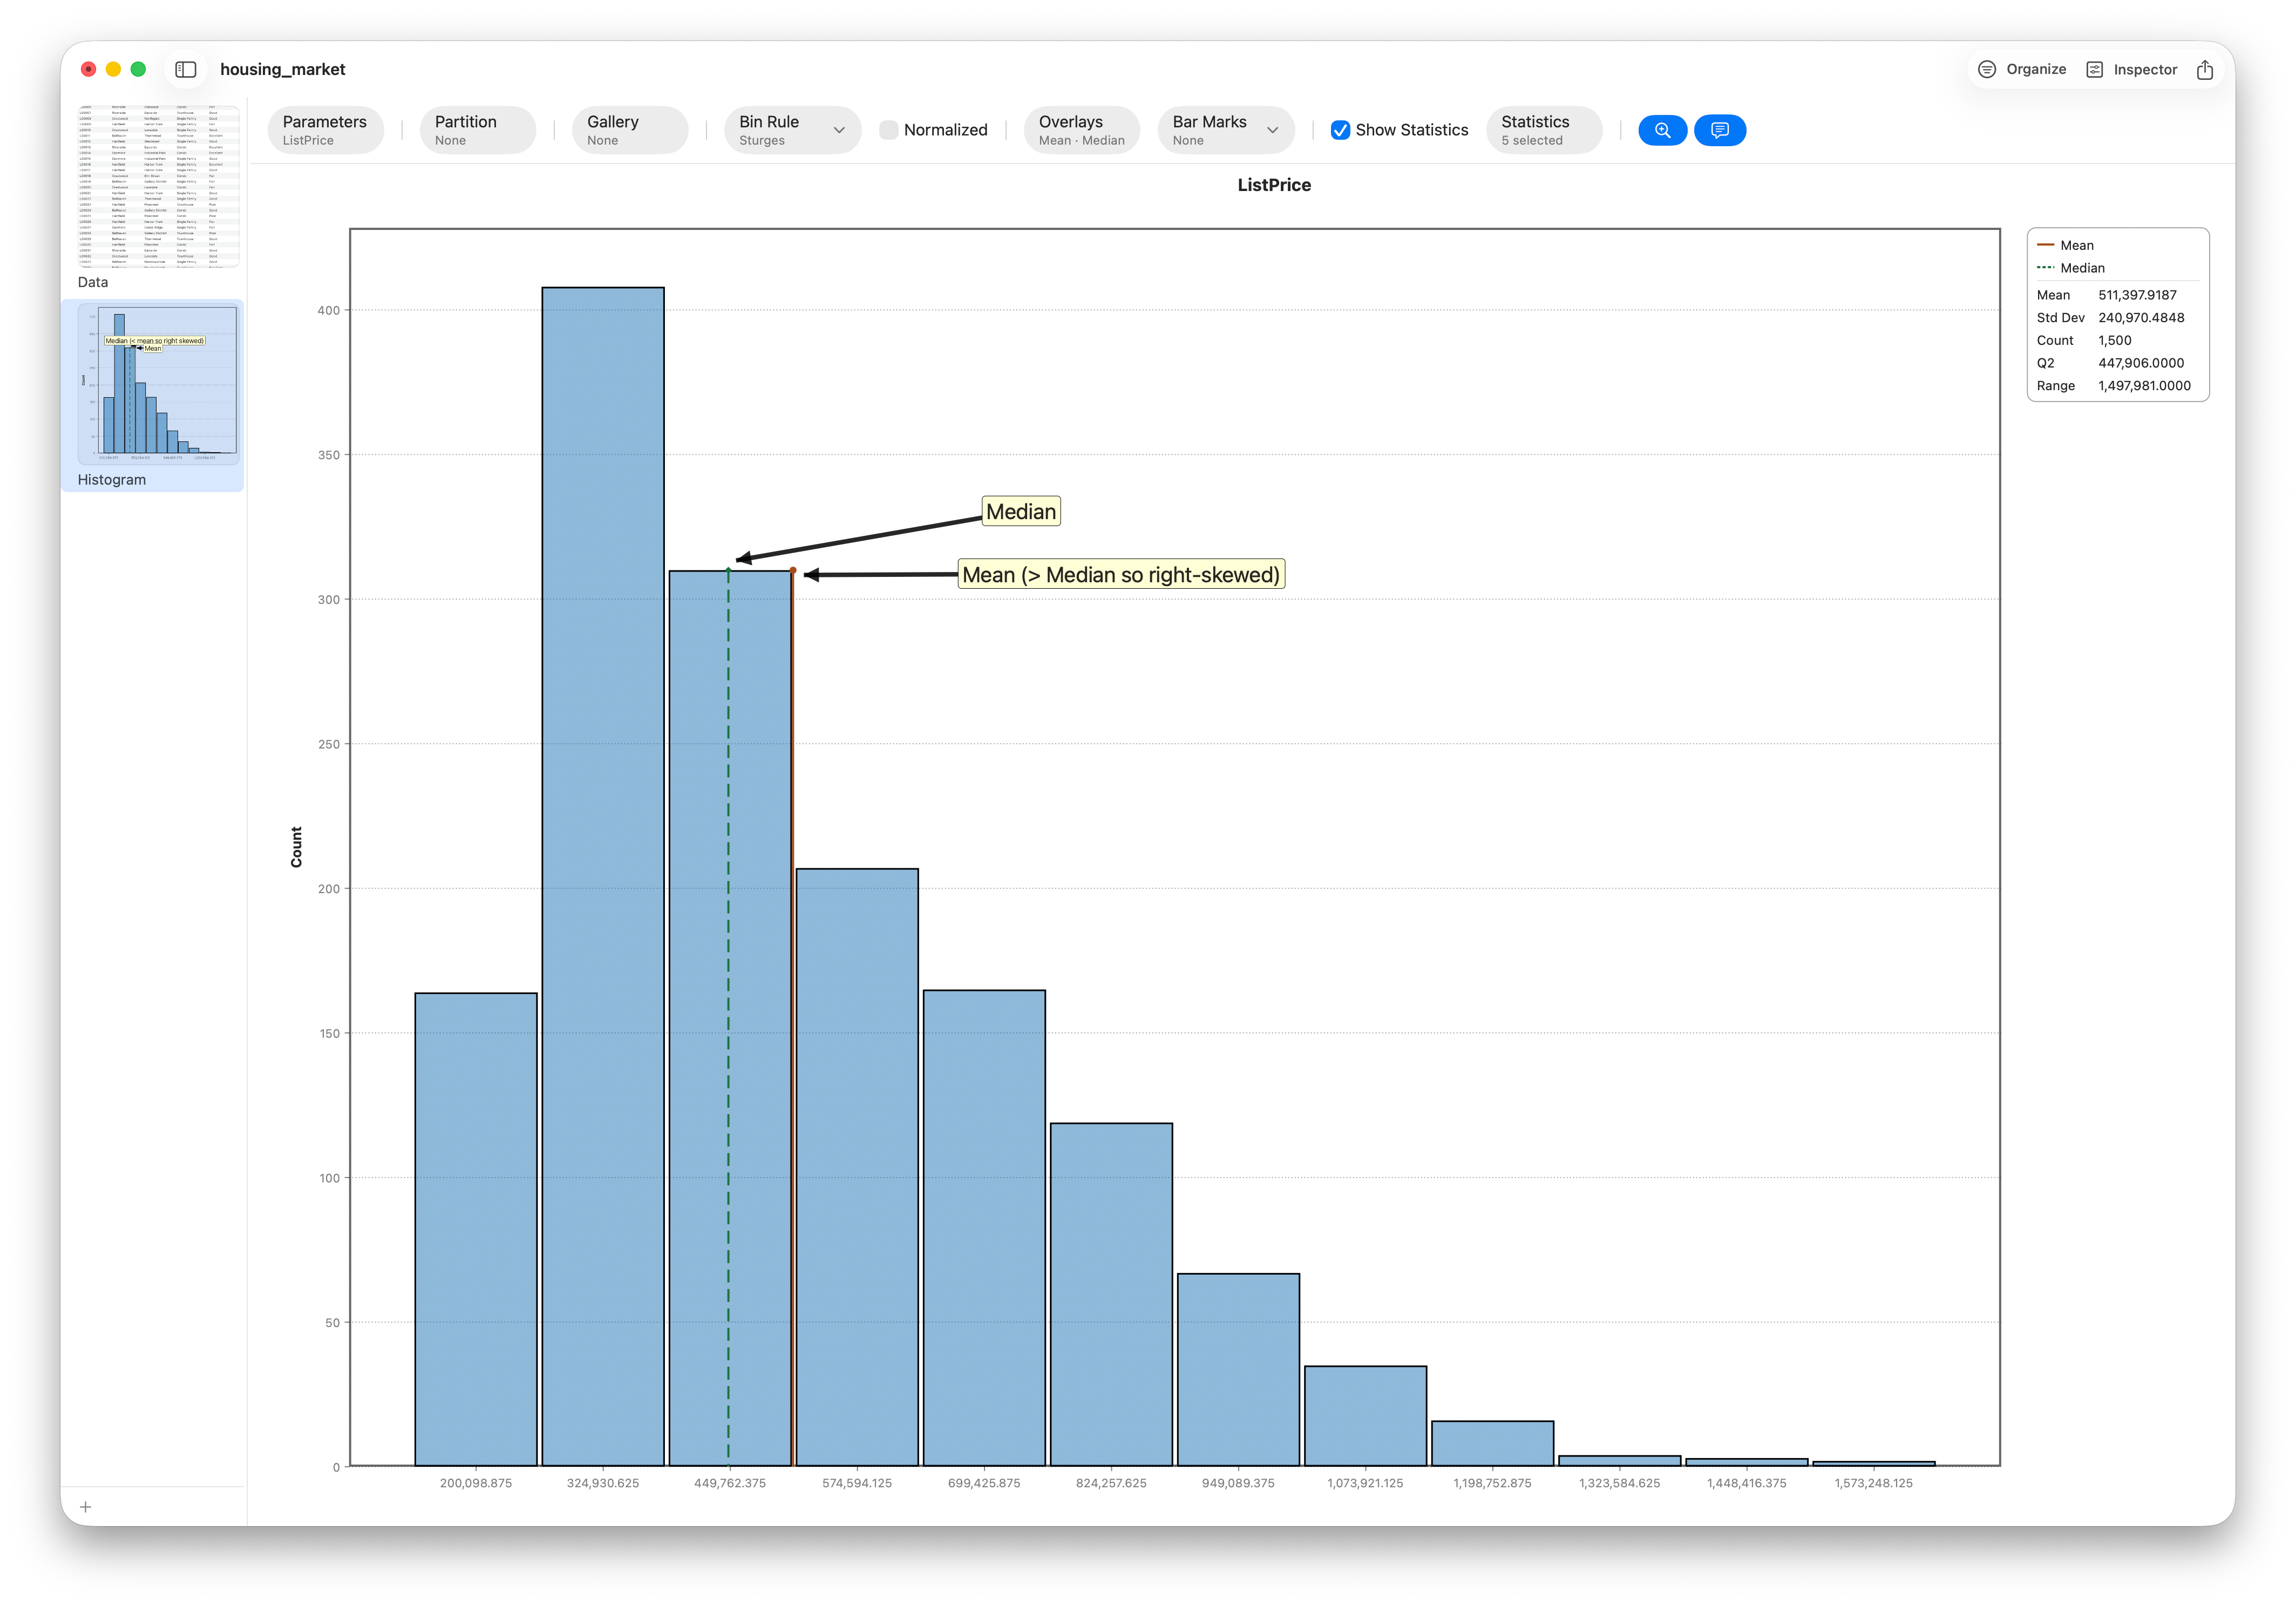
Two measures of center that agree for symmetric data and diverge for skewed data.
Jul 29, 2026 · 6 min read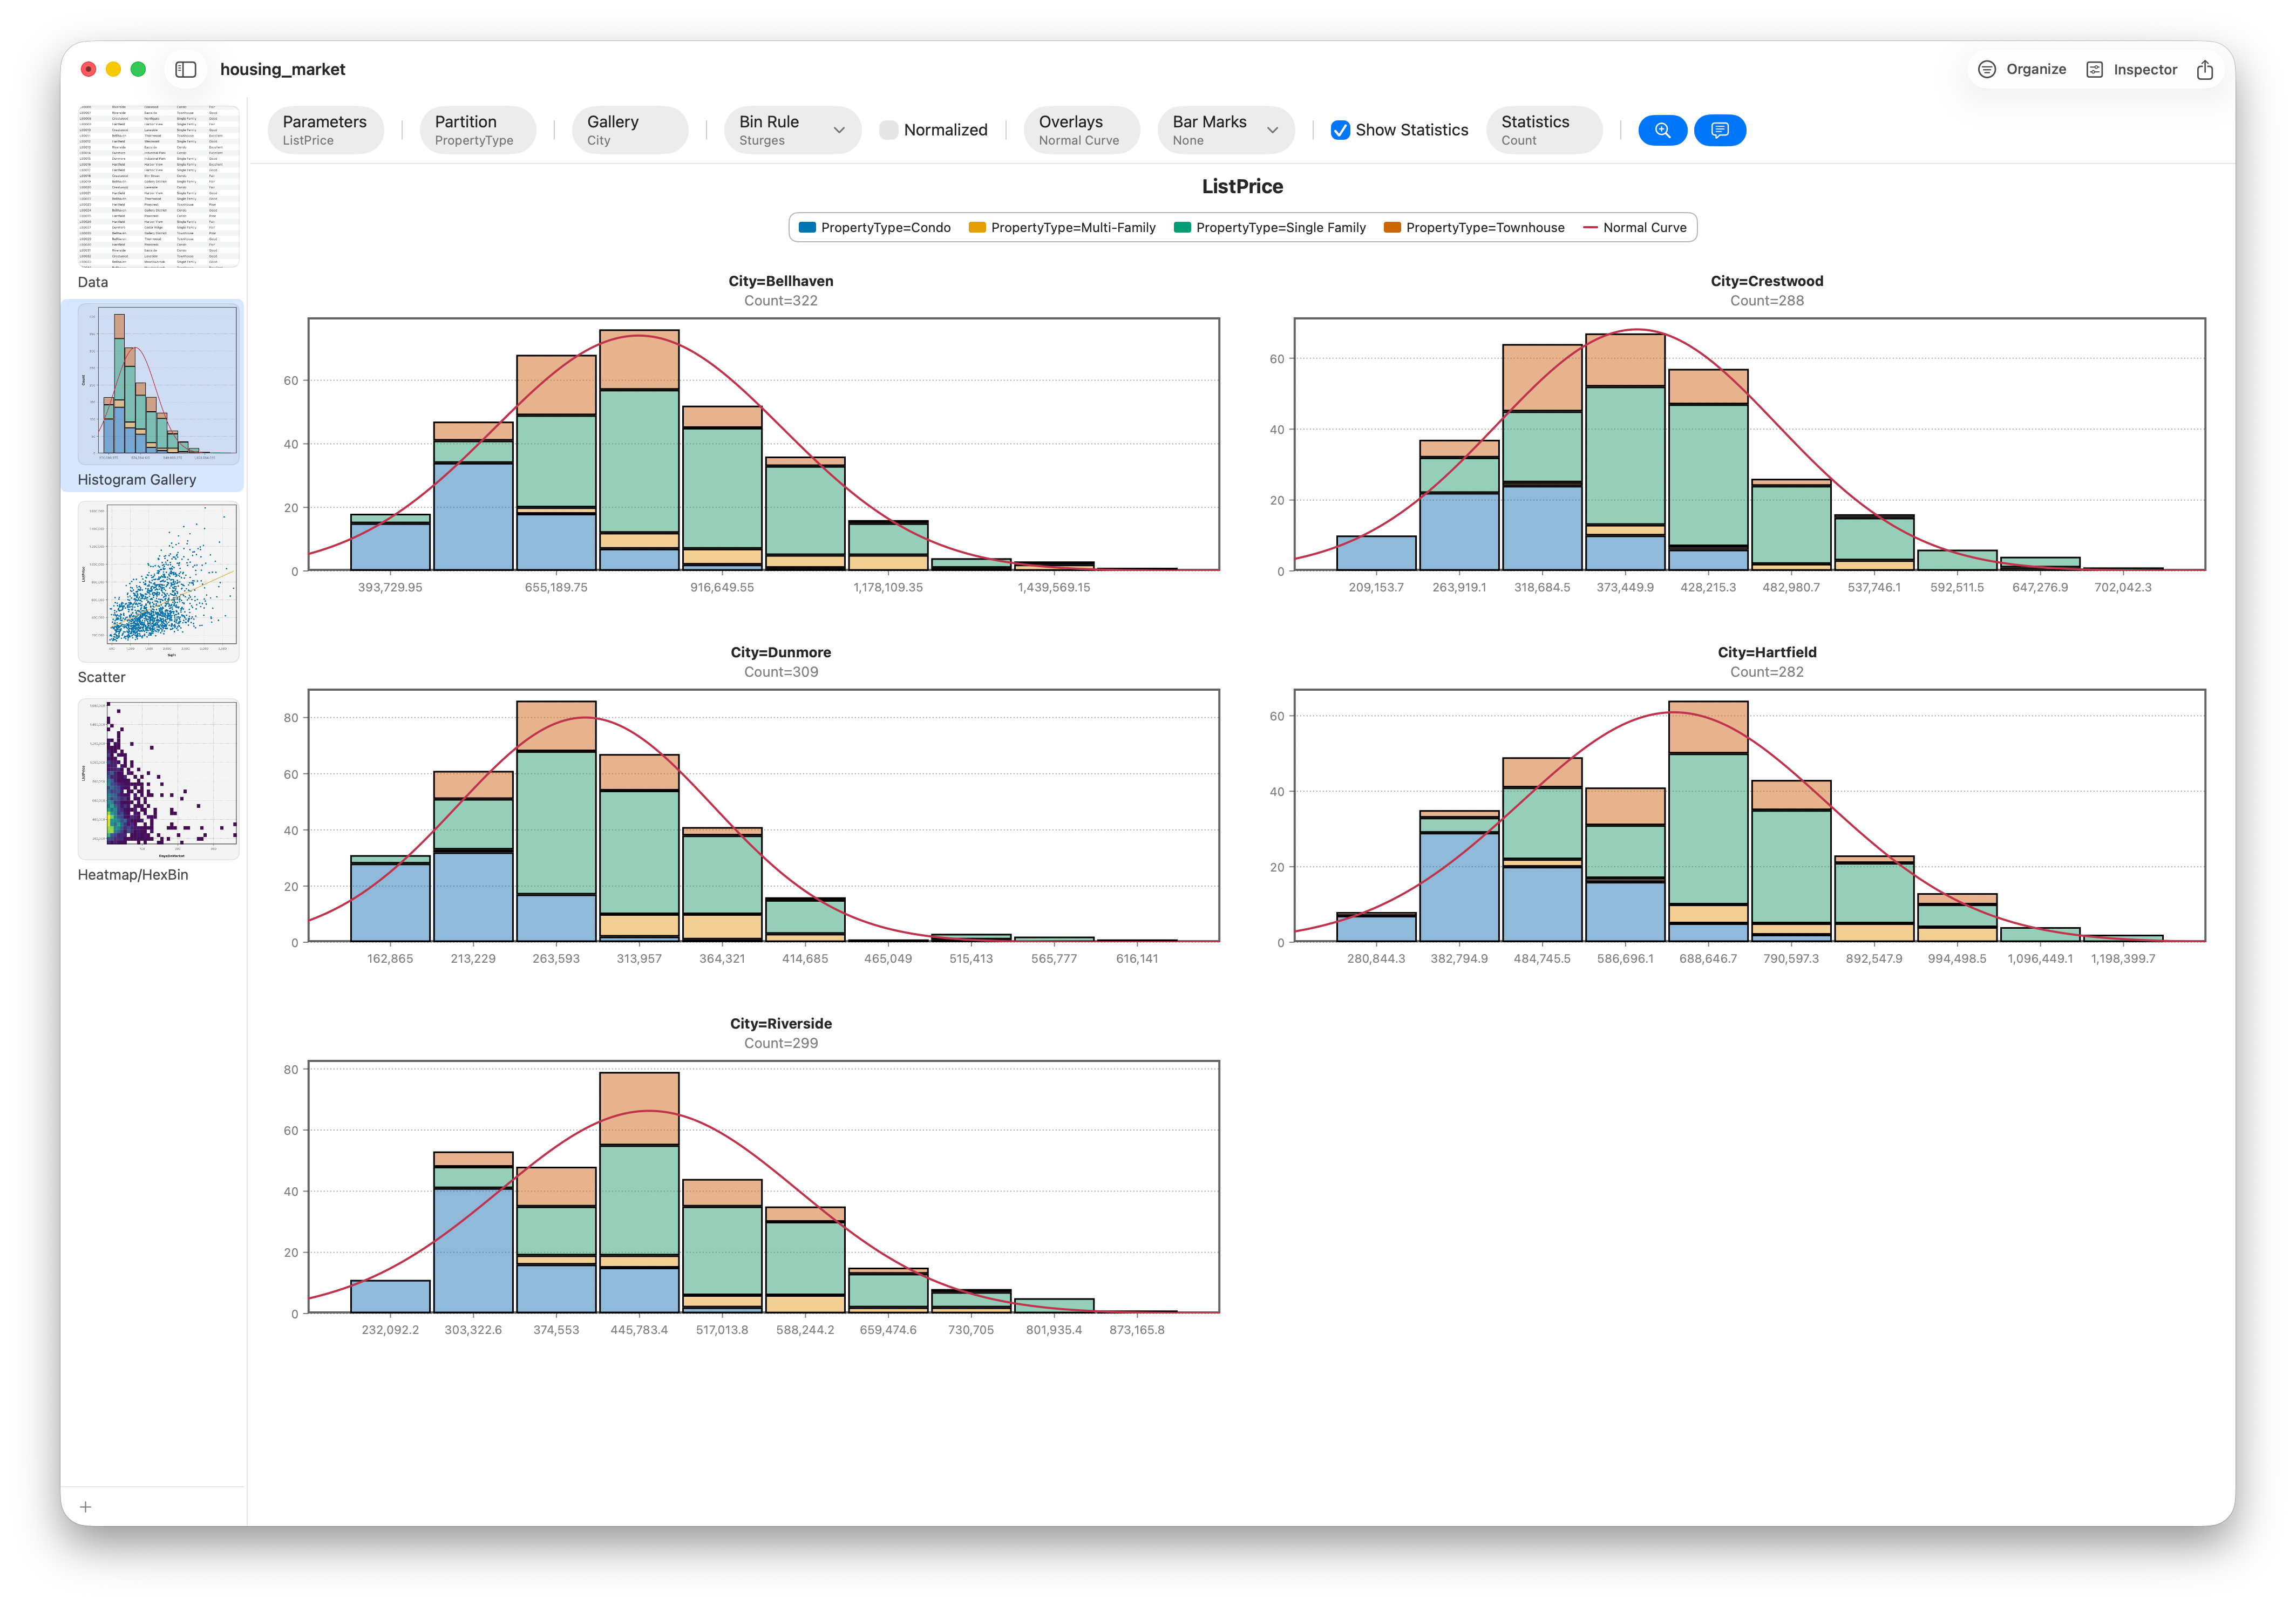
Two new Pro analyses, Connected Scatter, custom categorical ordering, skewness & kurtosis, and drag-to-export cards.
Jul 28, 2026 · 5 min read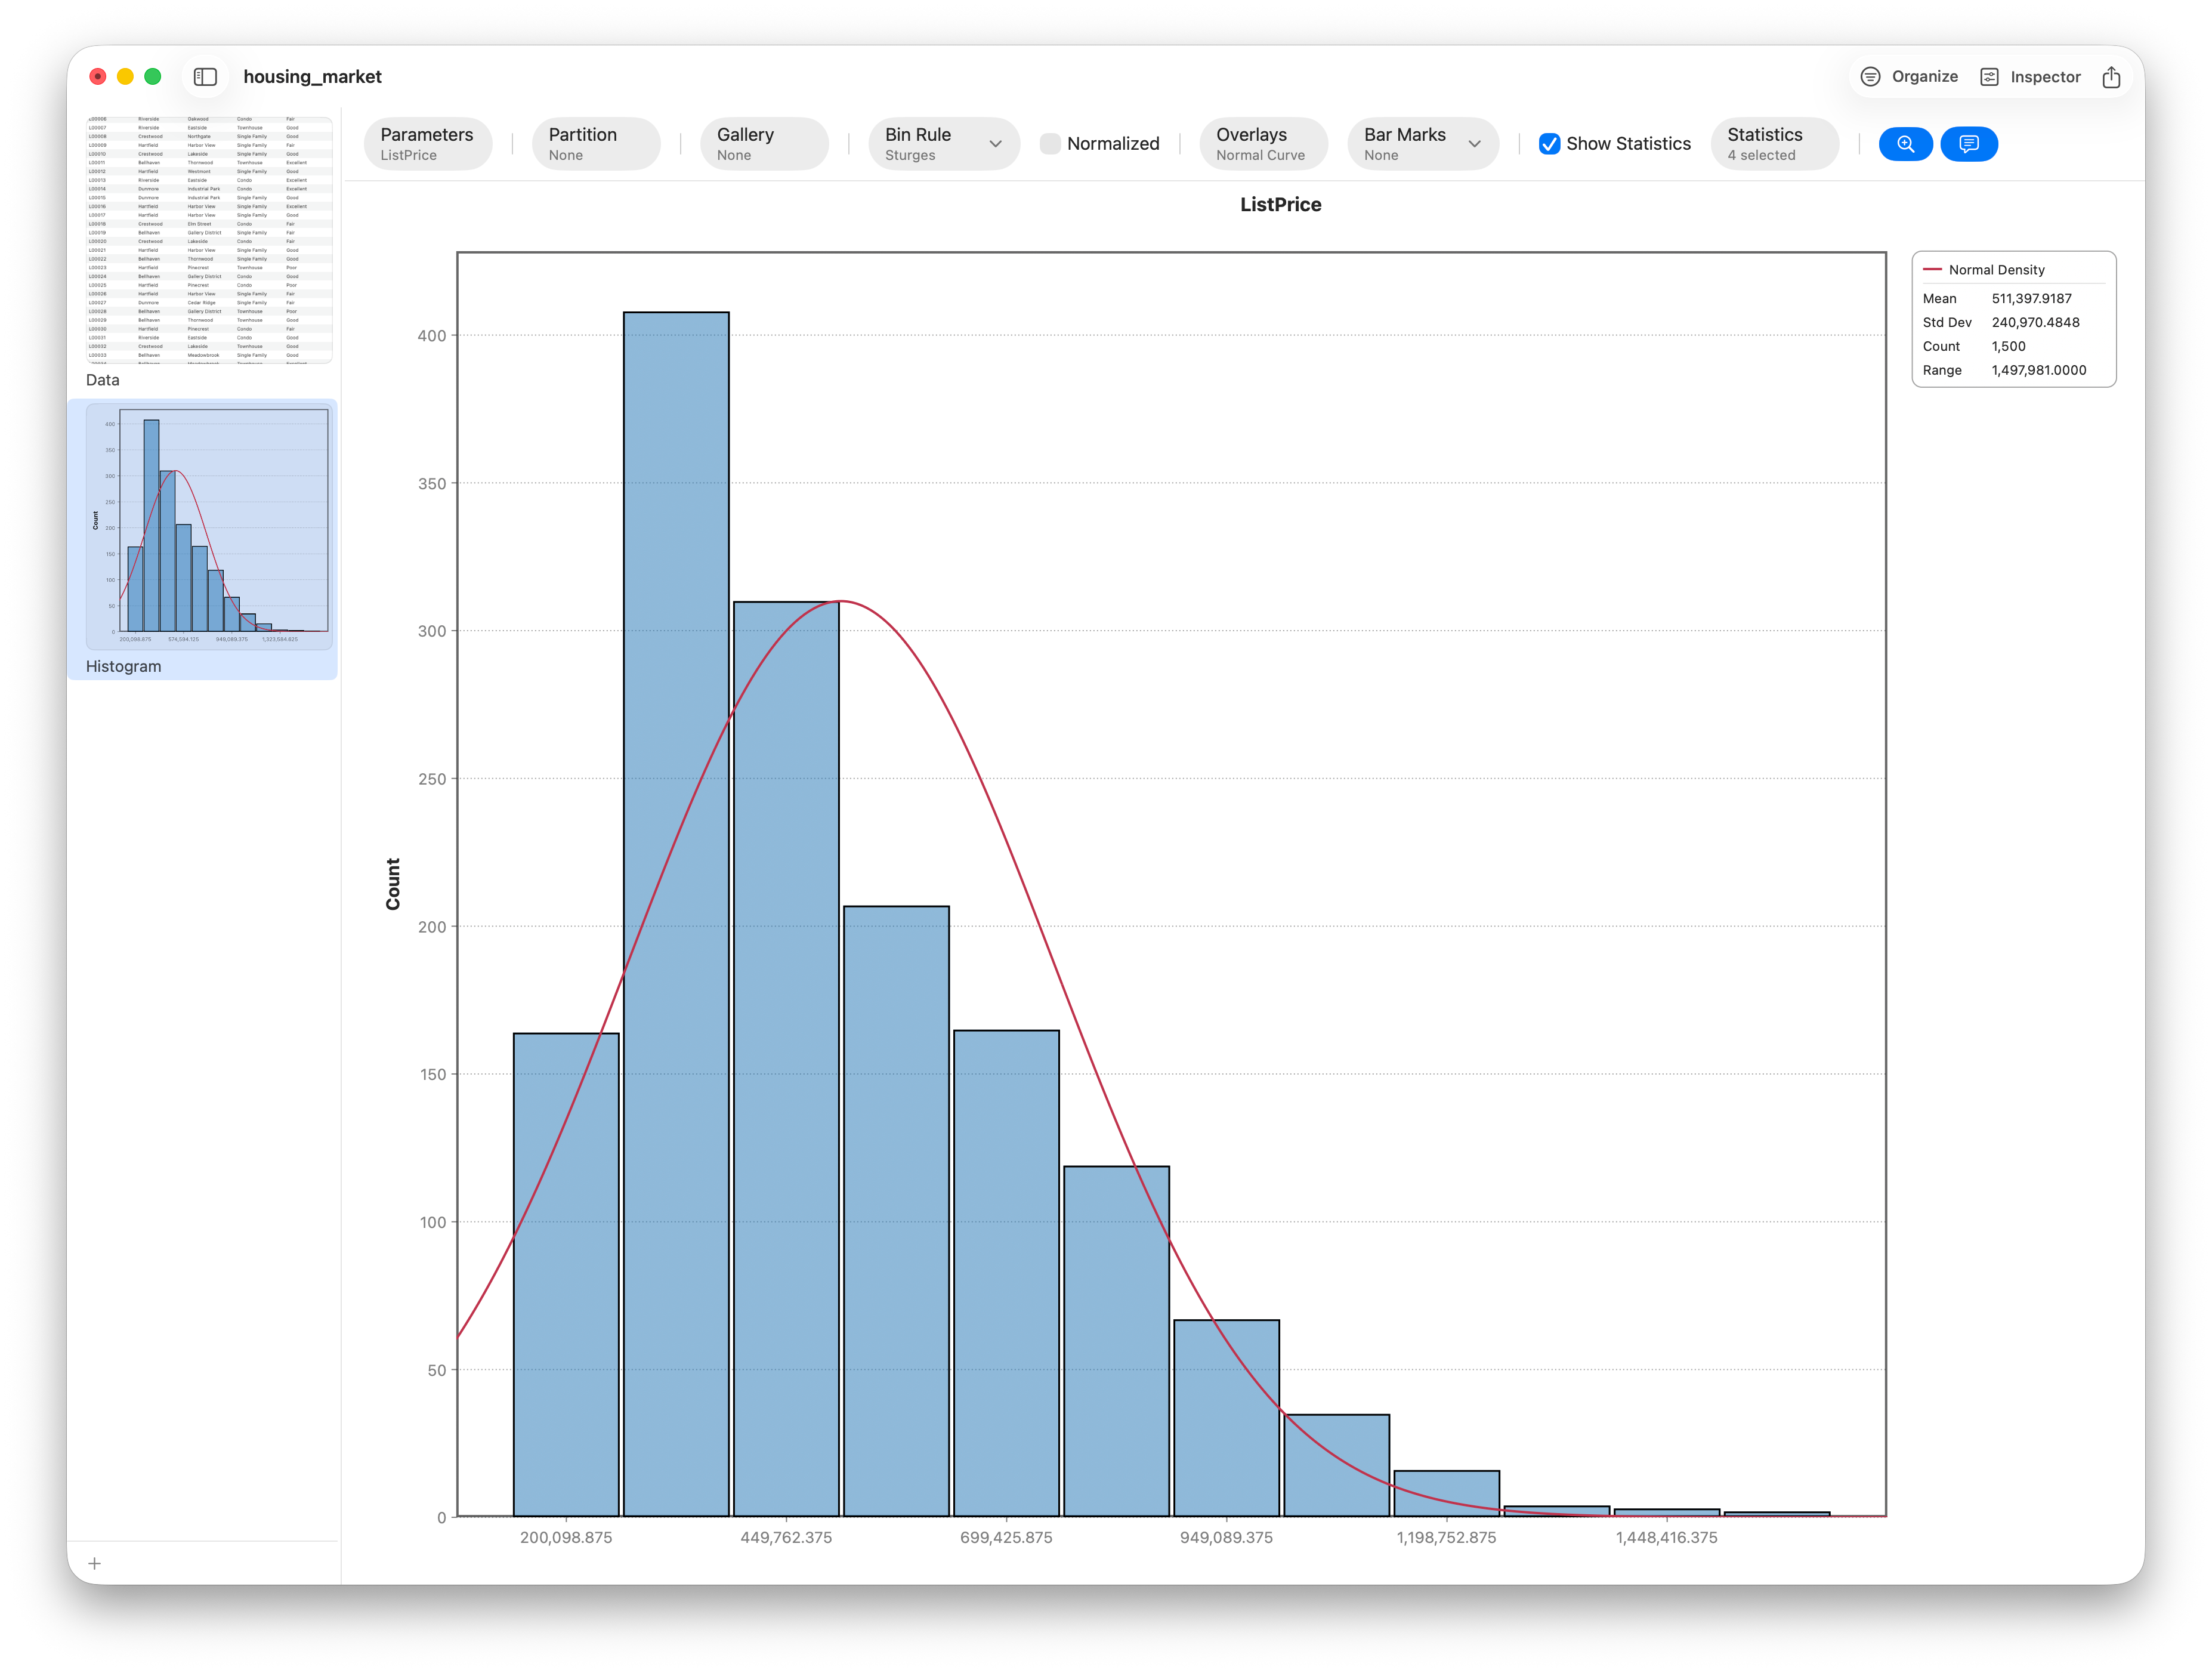
See the shape of a variable — pick bins, read skew, and export.
Jul 24, 2026 · 6 min readWhere Excel runs out of road for real statistics — and what a native Mac app does differently.
Jul 22, 2026 · 9 min read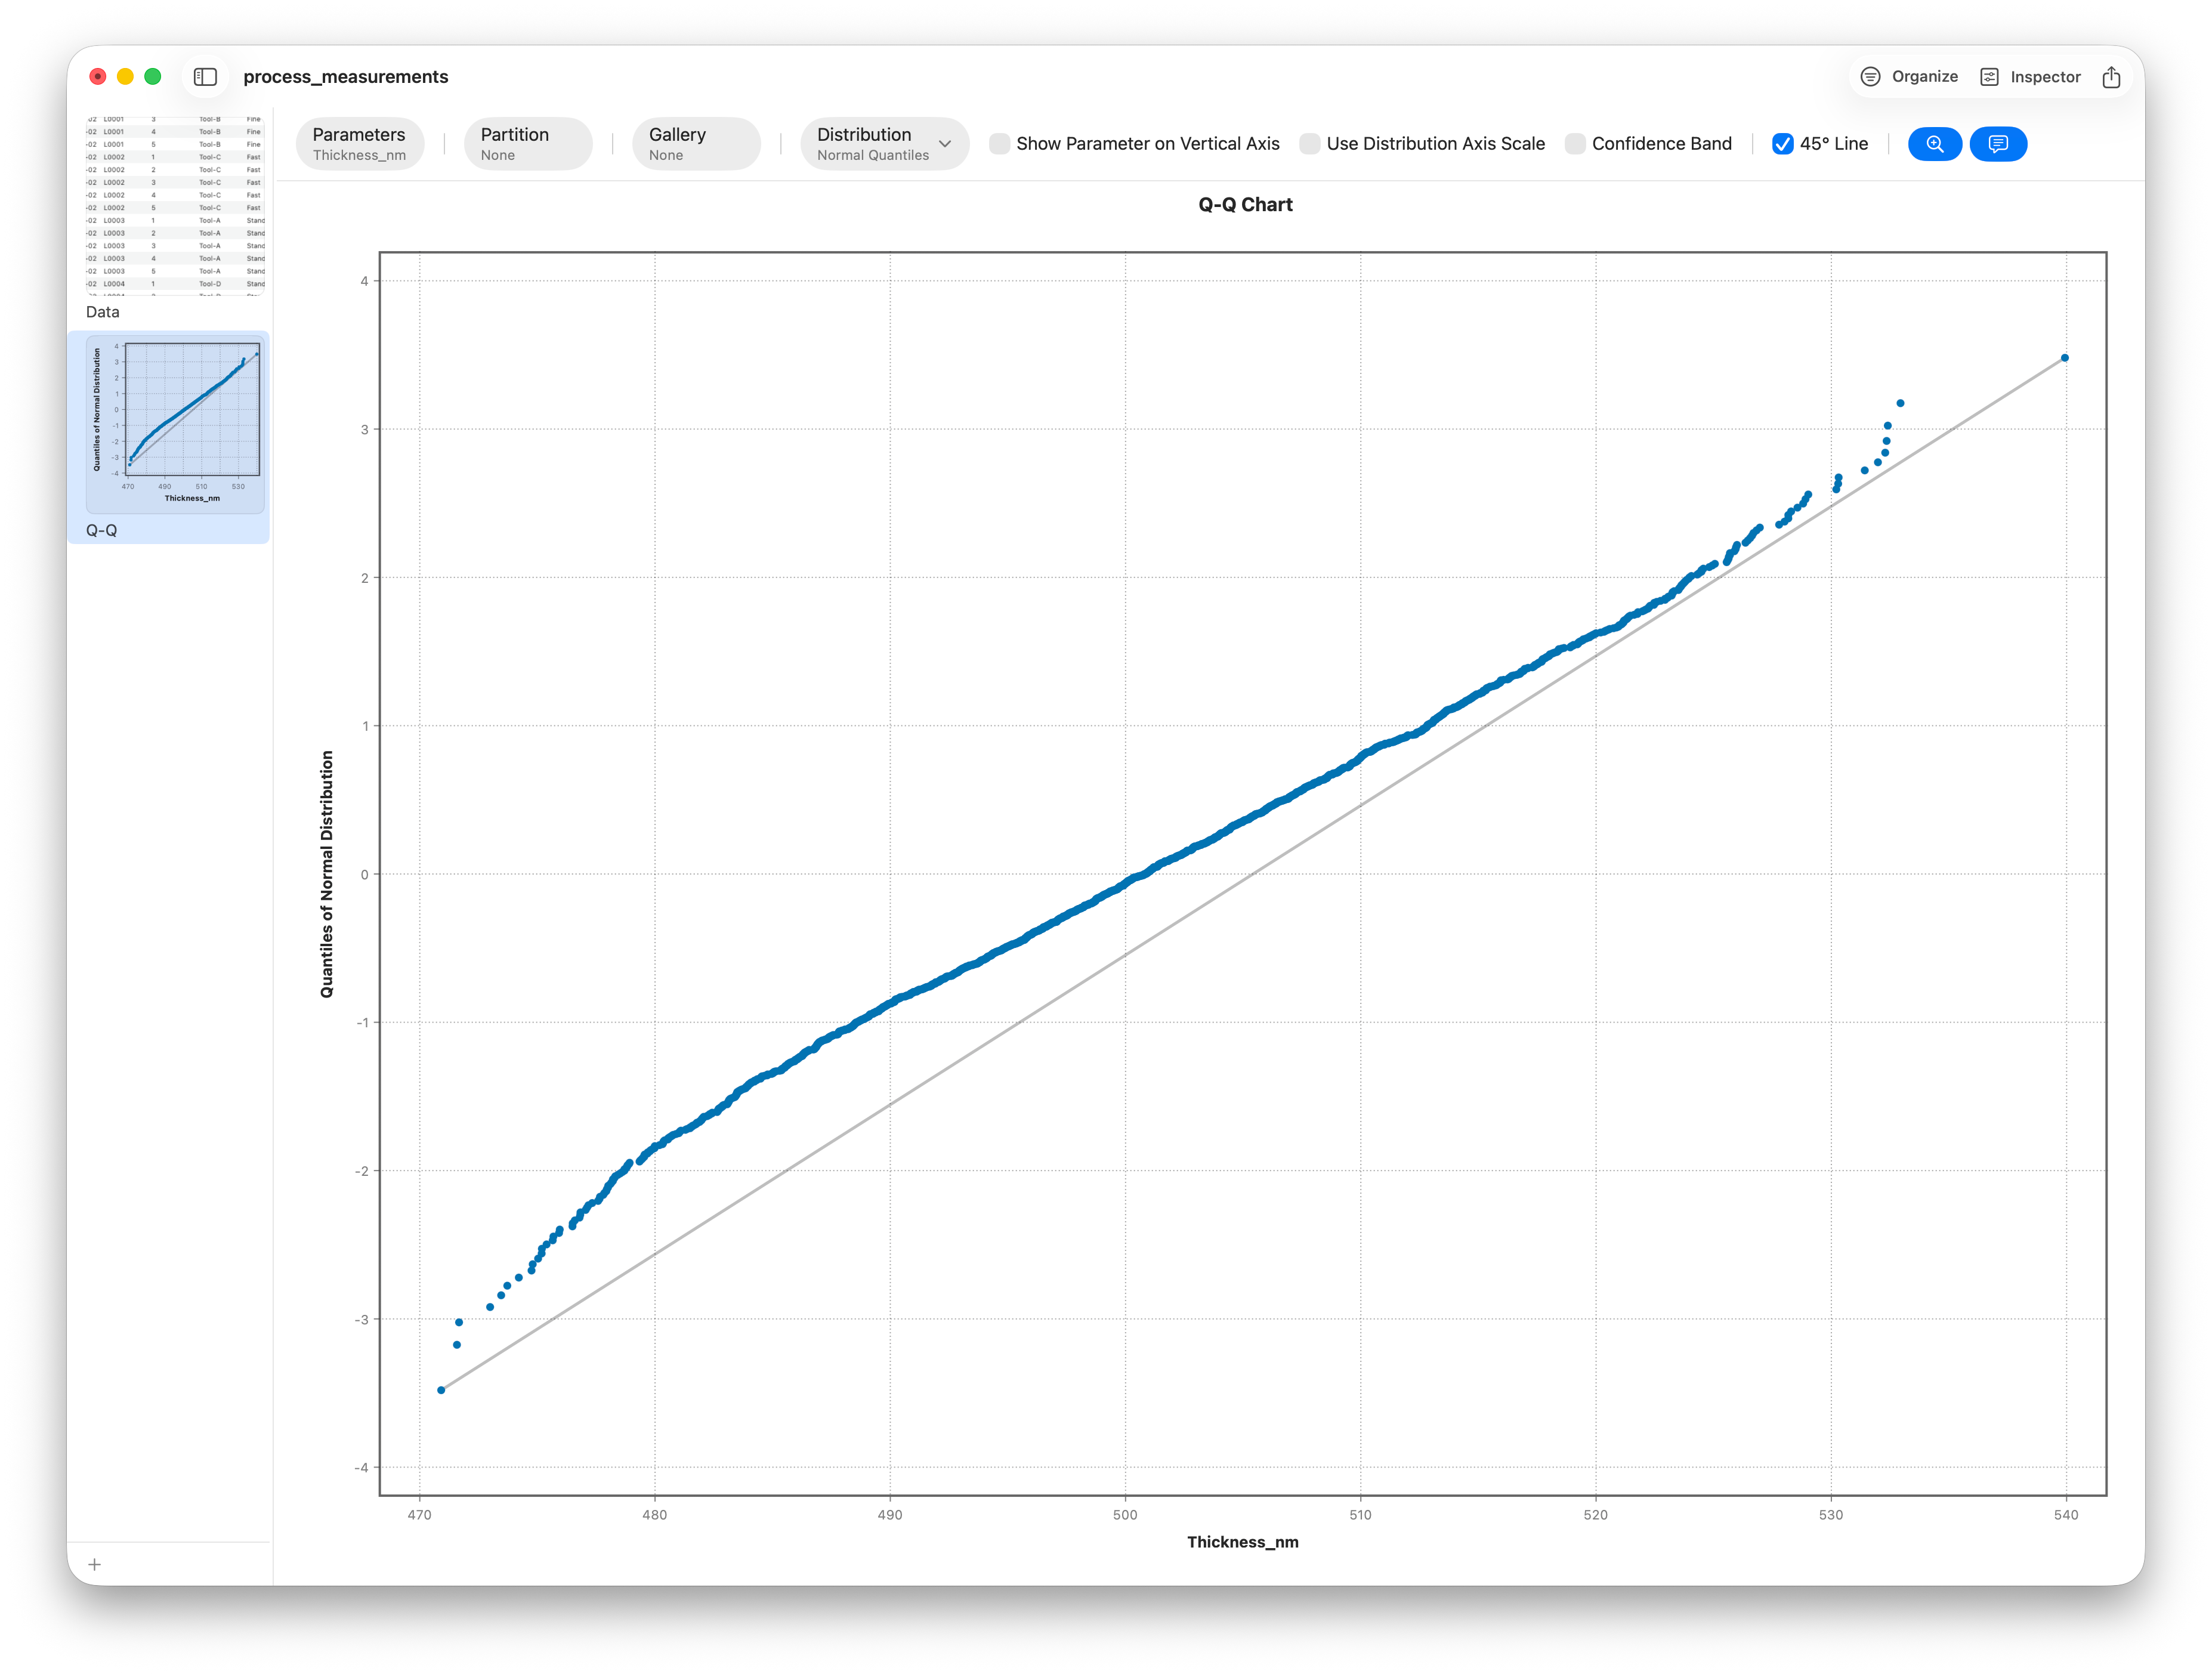
Normality, equal variance, independence — what each assumption means and how to check it.
Jul 17, 2026 · 9 min read
Compare three or more group means, read F and p, and run a Tukey post-hoc.
Jul 15, 2026 · 8 min read
Compare two groups and read the result in under a minute — no code, no notebooks.
Jul 10, 2026 · 6 min read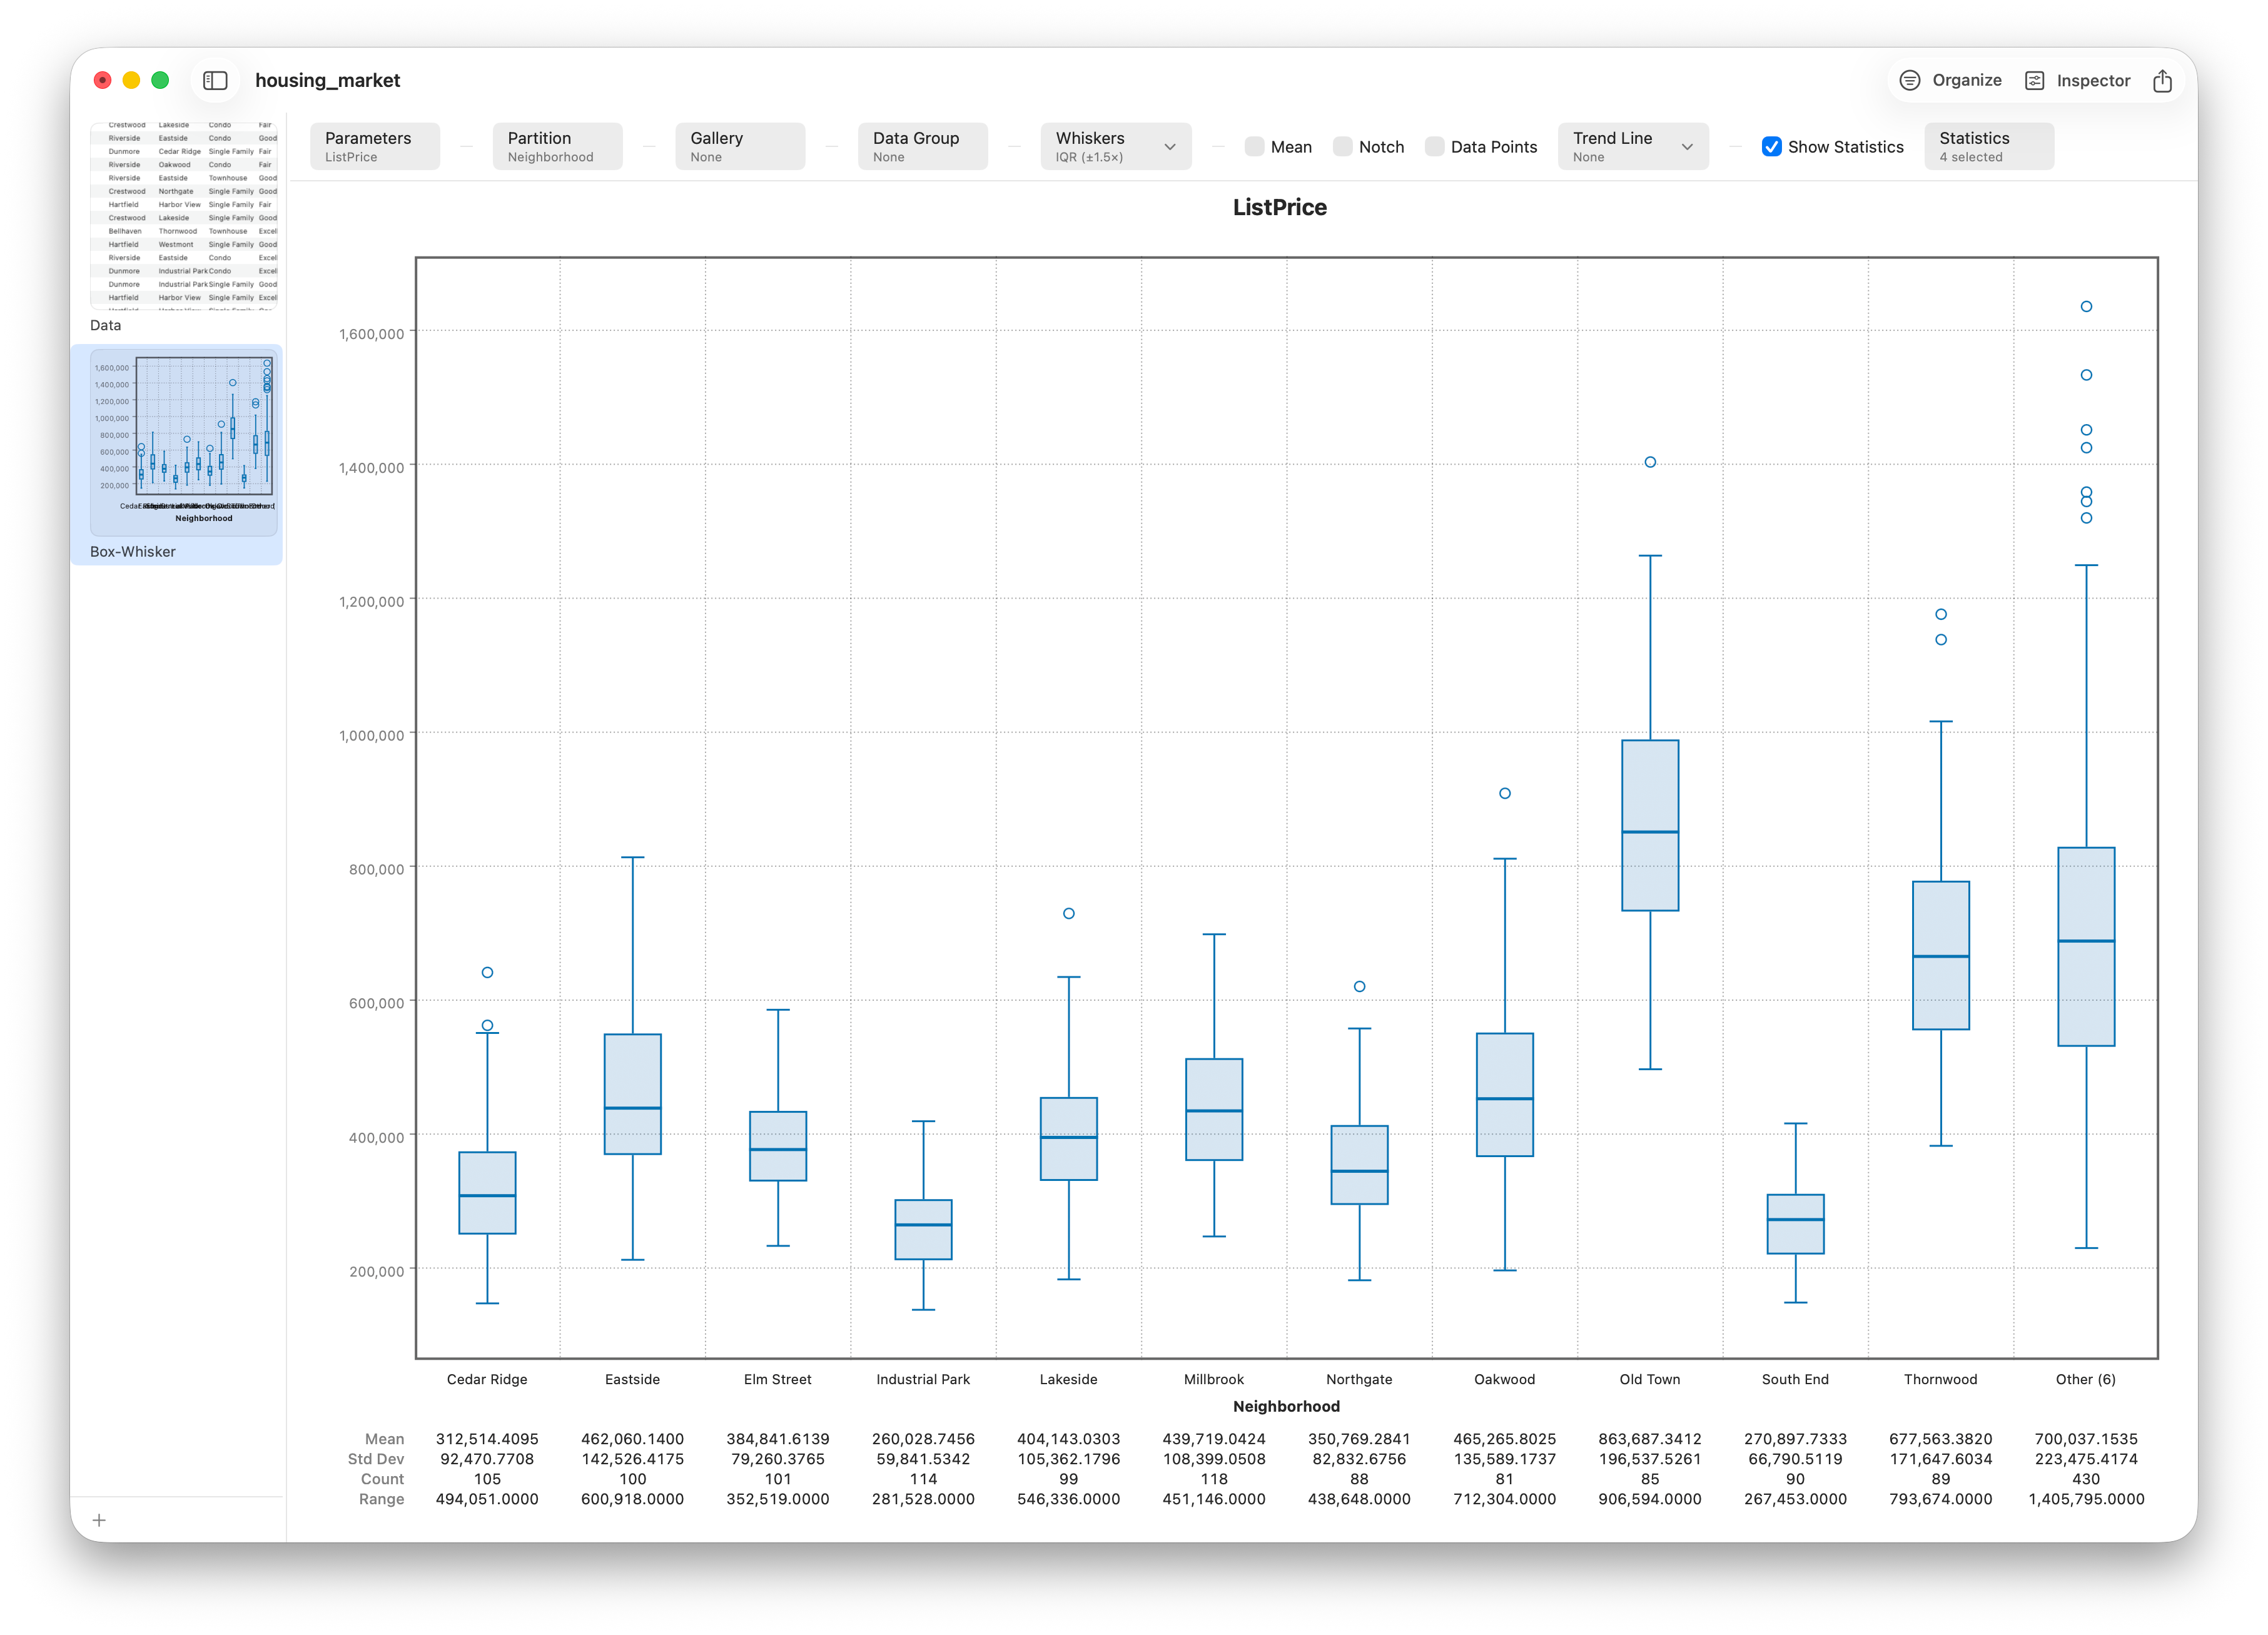
Median, quartiles, the IQR box, whiskers and outliers — read a box plot at a glance.
Jul 8, 2026 · 8 min read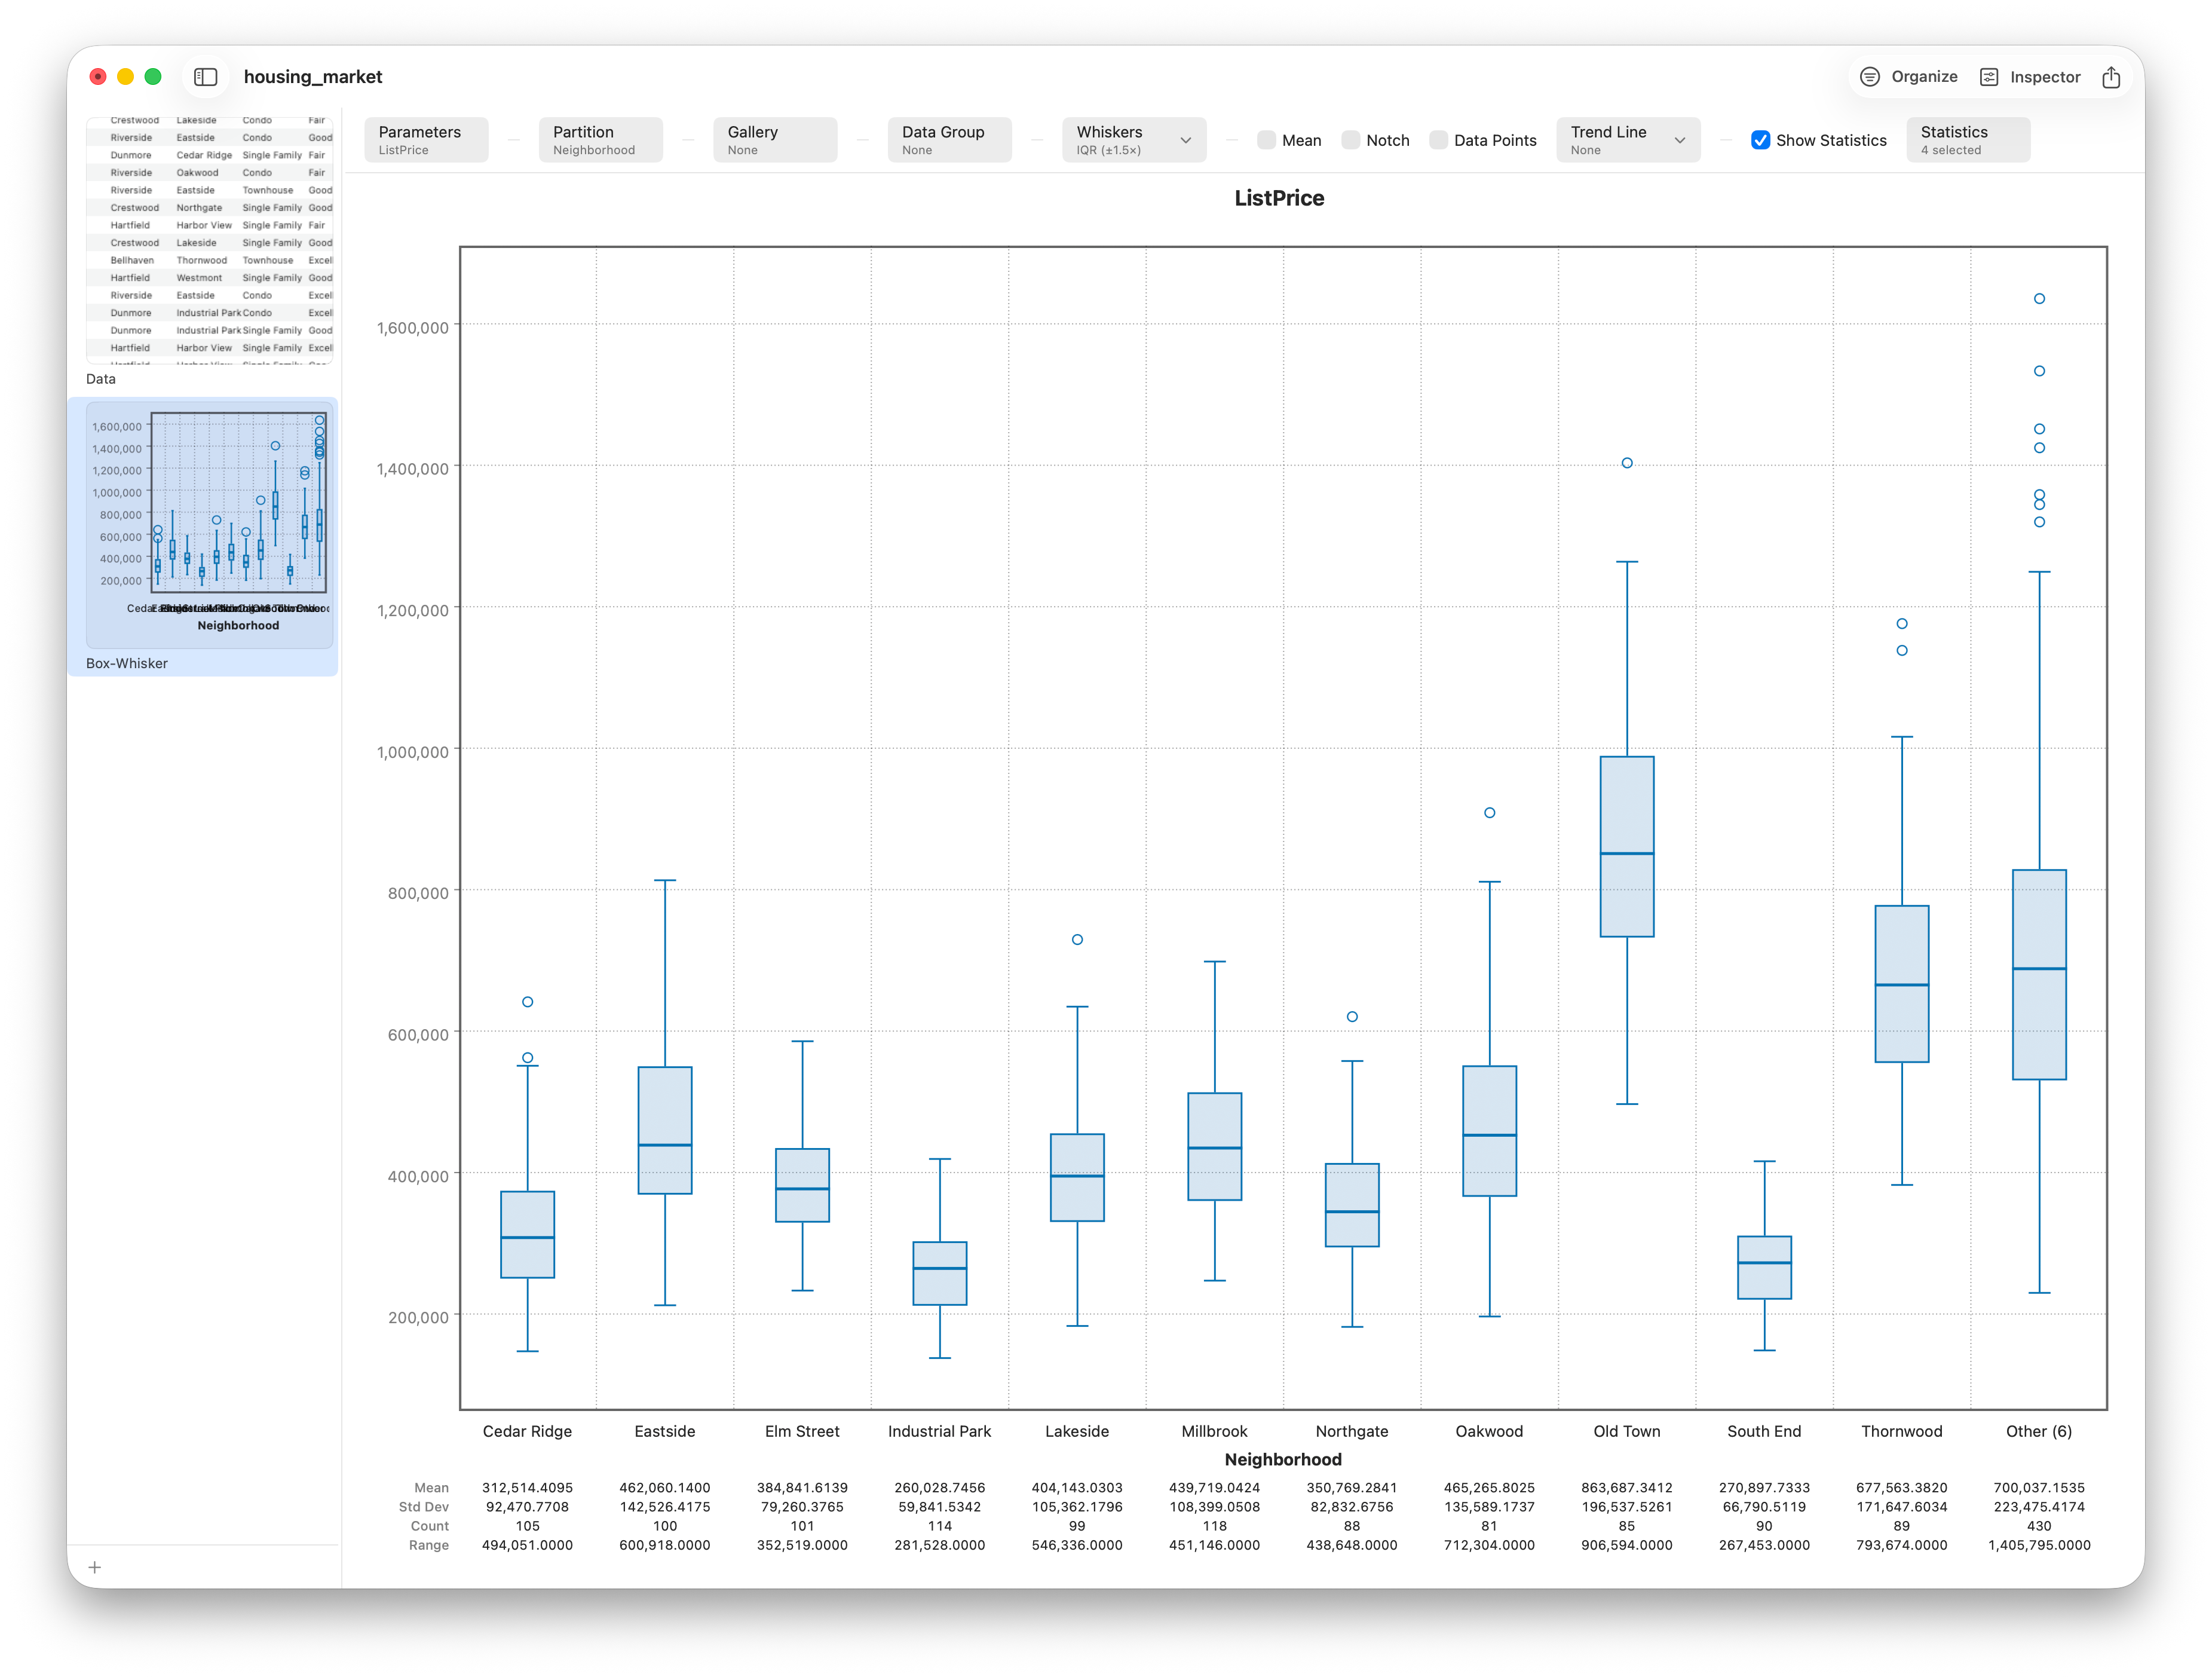
Compare groups and spot outliers with a box-and-whisker plot — in under a minute.
Jul 3, 2026 · 7 min readWhat Stratum is, who it's for, and why we built a native statistics app for the Mac.
Jul 1, 2026 · 5 min readCase studies, explainers, and how-tos are on the way. Subscribe via RSS or follow the video series to keep up.
 Stratum