Blog · Category
Real datasets analyzed end to end — from messy import to a defensible conclusion.

344 real penguins, a bill correlation that runs backwards until you split by species, then a decision tree, random forest and PCA that classify three species at ~98% — no code.
Dec 1, 2026 · 11 min read
Turn the most famous scatter in statistics into 142 connected trajectories and watch the development gap close — a full Gapminder analysis, no code, no animation.
Jan 4, 2027 · 14 min read
1,186 people, 14 characters, one chart. Correspondence Analysis maps a whole survey — and Jar Jar sits alone in the corner. No code.
Nov 2, 2026 · 10 min read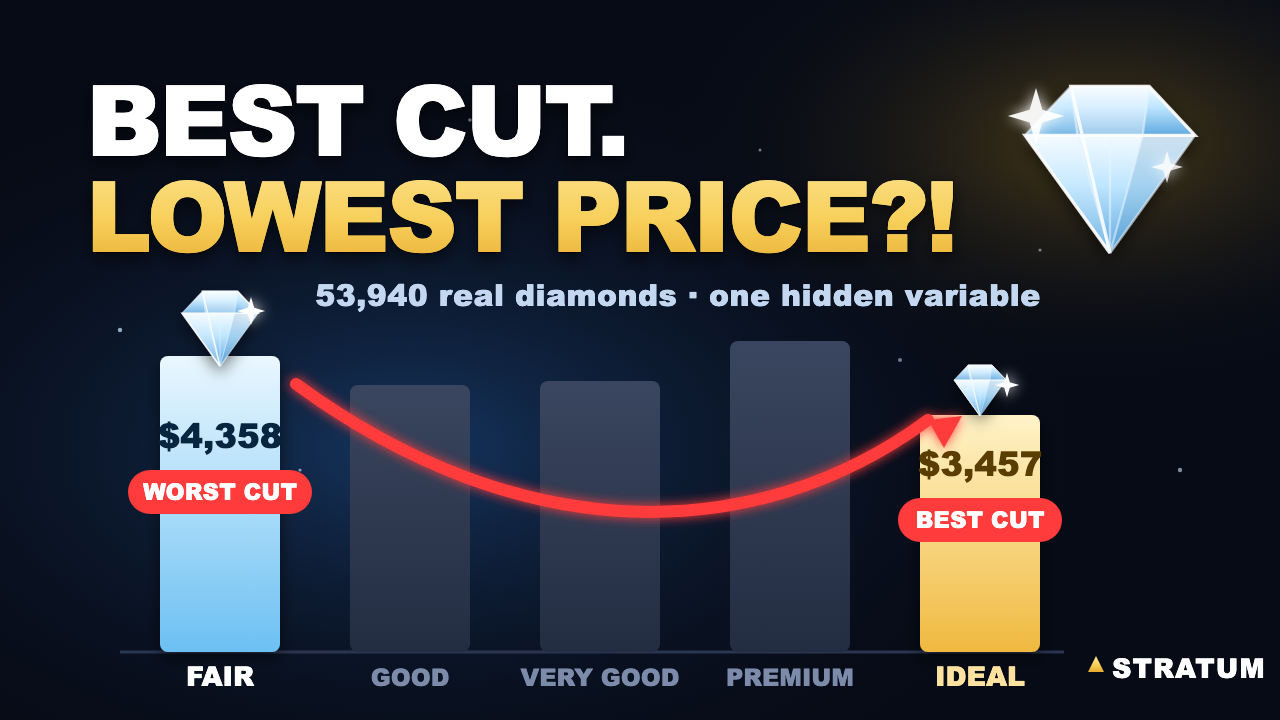
53,940 real diamonds, three quality grades that all run backwards, and the charts, ANOVA, regression, PCA and decision tree that crack it — no code.
Jul 31, 2026 · 13 min read
2,139 patients in the ACTG 175 HIV trial: the overall average said the drug worked, one arm said it harmed, and the honest answer lived in the subgroups — paired t-test, effect size, responder rate, ANOVA, MANOVA and ANCOVA. No code.
Sep 1, 2026 · 13 min read
A capability report says Ppk 1.36 — a pass. On 200 real piston-ring measurements, SPC control charts catch the drift that single number hides. The Six-Sigma rule: control before capability. No code.
Oct 1, 2026 · 6 min read Stratum